Data
83,911 items of data are available, covering 79,384 participants.
Defined-instances run from 2 to 3, labelled using Instancing
2.
Units of measurement are AU.
| Maximum | 0.002471 |
| Decile 9 | 0.001573 |
| Decile 8 | 0.001545 |
| Decile 7 | 0.001525 |
| Decile 6 | 0.001509 |
| Median | 0.001494 |
| Decile 4 | 0.00148 |
| Decile 3 | 0.001464 |
| Decile 2 | 0.001445 |
| Decile 1 | 0.001419 |
| Minimum | 0 |
|

|
- Mean = 0.00149572
- Std.dev = 6.36596e-05
- 44 items below graph minimum of 0.001265
- 150 items above graph maximum of 0.001727
|
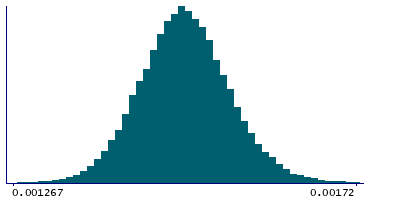
2 Instances
Instance 2 : Imaging visit (2014+)
79,153 participants, 79,153 items
| Maximum | 0.002471 |
| Decile 9 | 0.001574 |
| Decile 8 | 0.001546 |
| Decile 7 | 0.001526 |
| Decile 6 | 0.00151 |
| Median | 0.001496 |
| Decile 4 | 0.001481 |
| Decile 3 | 0.001465 |
| Decile 2 | 0.001447 |
| Decile 1 | 0.00142 |
| Minimum | 0 |
|
|
- Mean = 0.00149692
- Std.dev = 6.38052e-05
- 43 items below graph minimum of 0.001266
- 143 items above graph maximum of 0.001728
|
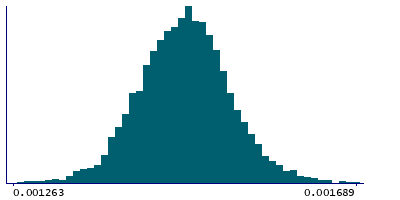
Instance 3 : First repeat imaging visit (2019+)
4,758 participants, 4,758 items
| Maximum | 0.001783 |
| Decile 9 | 0.001547 |
| Decile 8 | 0.00152 |
| Decile 7 | 0.001504 |
| Decile 6 | 0.001489 |
| Median | 0.001476 |
| Decile 4 | 0.001462 |
| Decile 3 | 0.001446 |
| Decile 2 | 0.001429 |
| Decile 1 | 0.001405 |
| Minimum | 0.001226 |
|
|
- Mean = 0.00147565
- Std.dev = 5.75927e-05
- 2 items below graph minimum of 0.001263
- 7 items above graph maximum of 0.001689
|
Notes
Mean L1 in posterior thalamic radiation (right) on FA (fractional anisotropy) skeleton (from dMRI data)
0 Related Data-Fields
There are no related data-fields

