Data
83,911 items of data are available, covering 79,384 participants.
Defined-instances run from 2 to 3, labelled using Instancing
2.
Units of measurement are AU.
| Maximum | 0.002292 |
| Decile 9 | 0.001242 |
| Decile 8 | 0.001218 |
| Decile 7 | 0.001205 |
| Decile 6 | 0.001194 |
| Median | 0.001184 |
| Decile 4 | 0.001175 |
| Decile 3 | 0.001166 |
| Decile 2 | 0.001155 |
| Decile 1 | 0.001141 |
| Minimum | 0 |
|
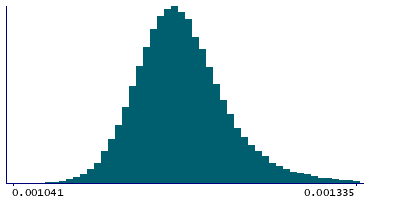
|
- Mean = 0.0011892
- Std.dev = 4.4192e-05
- 16 items below graph minimum of 0.00104
- 588 items above graph maximum of 0.001343
|
2 Instances
Instance 2 : Imaging visit (2014+)
79,153 participants, 79,153 items
| Maximum | 0.002292 |
| Decile 9 | 0.001243 |
| Decile 8 | 0.001219 |
| Decile 7 | 0.001205 |
| Decile 6 | 0.001194 |
| Median | 0.001185 |
| Decile 4 | 0.001176 |
| Decile 3 | 0.001166 |
| Decile 2 | 0.001156 |
| Decile 1 | 0.001141 |
| Minimum | 0 |
|
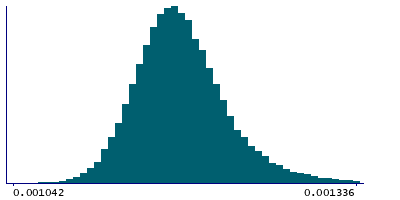
|
- Mean = 0.00118971
- Std.dev = 4.44095e-05
- 15 items below graph minimum of 0.001039
- 558 items above graph maximum of 0.001345
|
Instance 3 : First repeat imaging visit (2019+)
4,758 participants, 4,758 items
| Maximum | 0.001493 |
| Decile 9 | 0.001228 |
| Decile 8 | 0.001208 |
| Decile 7 | 0.001195 |
| Decile 6 | 0.001186 |
| Median | 0.001177 |
| Decile 4 | 0.001168 |
| Decile 3 | 0.00116 |
| Decile 2 | 0.00115 |
| Decile 1 | 0.001137 |
| Minimum | 0.001029 |
|
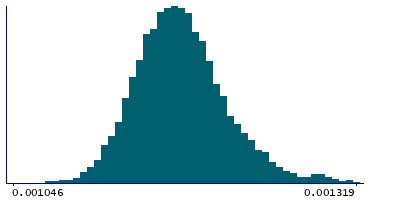
|
- Mean = 0.00118066
- Std.dev = 3.94338e-05
- 1 item below graph minimum of 0.001046
- 33 items above graph maximum of 0.001319
|
Notes
Mean L1 in external capsule (right) on FA (fractional anisotropy) skeleton (from dMRI data)
0 Related Data-Fields
There are no related data-fields

