Data
83,911 items of data are available, covering 79,384 participants.
Defined-instances run from 2 to 3, labelled using Instancing
2.
Units of measurement are AU.
| Maximum | 0.002039 |
| Decile 9 | 0.001472 |
| Decile 8 | 0.001448 |
| Decile 7 | 0.001431 |
| Decile 6 | 0.001416 |
| Median | 0.001401 |
| Decile 4 | 0.001387 |
| Decile 3 | 0.001372 |
| Decile 2 | 0.001354 |
| Decile 1 | 0.001327 |
| Minimum | 0.000706 |
|
|
- Mean = 0.00140009
- Std.dev = 5.77365e-05
- 72 items below graph minimum of 0.001182
- 5 items above graph maximum of 0.001617
|
2 Instances
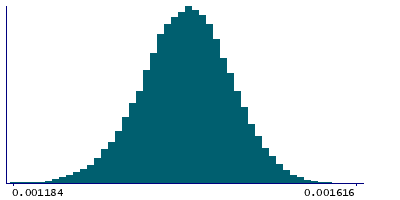
Instance 2 : Imaging visit (2014+)
79,153 participants, 79,153 items
| Maximum | 0.002039 |
| Decile 9 | 0.001472 |
| Decile 8 | 0.001448 |
| Decile 7 | 0.00143 |
| Decile 6 | 0.001415 |
| Median | 0.001401 |
| Decile 4 | 0.001387 |
| Decile 3 | 0.001372 |
| Decile 2 | 0.001353 |
| Decile 1 | 0.001327 |
| Minimum | 0.000706 |
|

|
- Mean = 0.00139995
- Std.dev = 5.78942e-05
- 69 items below graph minimum of 0.001182
- 4 items above graph maximum of 0.001617
|
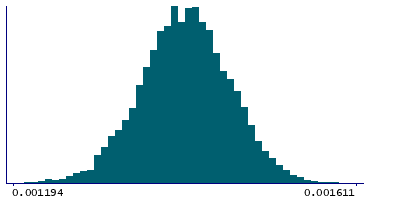
Instance 3 : First repeat imaging visit (2019+)
4,758 participants, 4,758 items
| Maximum | 0.001695 |
| Decile 9 | 0.001472 |
| Decile 8 | 0.001448 |
| Decile 7 | 0.001431 |
| Decile 6 | 0.001417 |
| Median | 0.001403 |
| Decile 4 | 0.001389 |
| Decile 3 | 0.001375 |
| Decile 2 | 0.001358 |
| Decile 1 | 0.0013325 |
| Minimum | 0.000923 |
|
|
- Mean = 0.00140251
- Std.dev = 5.49906e-05
- 3 items below graph minimum of 0.001193
- 1 item above graph maximum of 0.0016115
|
Notes
Mean L1 in cingulum cingulate gyrus (left) on FA (fractional anisotropy) skeleton (from dMRI data)
0 Related Data-Fields
There are no related data-fields

