Data
64,947 items of data are available, covering 60,419 participants.
Defined-instances run from 2 to 3, labelled using Instancing
2.
Units of measurement are AU.
| Maximum | 0.00209 |
| Decile 9 | 0.001313 |
| Decile 8 | 0.001289 |
| Decile 7 | 0.001272 |
| Decile 6 | 0.001258 |
| Median | 0.001245 |
| Decile 4 | 0.001232 |
| Decile 3 | 0.001218 |
| Decile 2 | 0.001201 |
| Decile 1 | 0.001179 |
| Minimum | 0 |
|

|
- Mean = 0.00124548
- Std.dev = 5.42276e-05
- 20 items below graph minimum of 0.001045
- 51 items above graph maximum of 0.001447
|
2 Instances
Instance 2 : Imaging visit (2014+)
60,187 participants, 60,187 items
| Maximum | 0.00209 |
| Decile 9 | 0.001314 |
| Decile 8 | 0.00129 |
| Decile 7 | 0.001273 |
| Decile 6 | 0.001259 |
| Median | 0.001246 |
| Decile 4 | 0.001233 |
| Decile 3 | 0.001218 |
| Decile 2 | 0.001202 |
| Decile 1 | 0.00118 |
| Minimum | 0 |
|

|
- Mean = 0.00124641
- Std.dev = 5.42248e-05
- 18 items below graph minimum of 0.001046
- 42 items above graph maximum of 0.001448
|
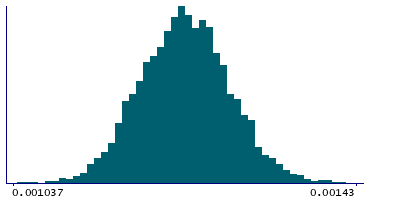
Instance 3 : First repeat imaging visit (2019+)
4,760 participants, 4,760 items
| Maximum | 0.00182 |
| Decile 9 | 0.001299 |
| Decile 8 | 0.001276 |
| Decile 7 | 0.00126 |
| Decile 6 | 0.001246 |
| Median | 0.001233 |
| Decile 4 | 0.001221 |
| Decile 3 | 0.001206 |
| Decile 2 | 0.00119 |
| Decile 1 | 0.001168 |
| Minimum | 0.001018 |
|
|
- Mean = 0.00123375
- Std.dev = 5.28763e-05
- 1 item below graph minimum of 0.001037
- 7 items above graph maximum of 0.00143
|
Notes
Mean L1 in uncinate fasciculus (right) on FA (fractional anisotropy) skeleton (from dMRI data)
0 Related Data-Fields
There are no related data-fields

