Data
64,947 items of data are available, covering 60,419 participants.
Defined-instances run from 2 to 3, labelled using Instancing
2.
Units of measurement are AU.
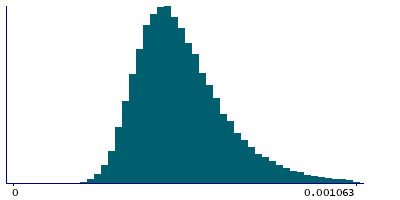
| Maximum | 0.002834 |
| Decile 9 | 0.000715 |
| Decile 8 | 0.000628 |
| Decile 7 | 0.000575 |
| Decile 6 | 0.000535 |
| Median | 0.000501 |
| Decile 4 | 0.00047 |
| Decile 3 | 0.00044 |
| Decile 2 | 0.000408 |
| Decile 1 | 0.000367 |
| Minimum | -0.000175 |
|
|
- Mean = 0.000526248
- Std.dev = 0.000147606
- 1 item below graph minimum of 0
- 384 items above graph maximum of 0.001063
|
2 Instances
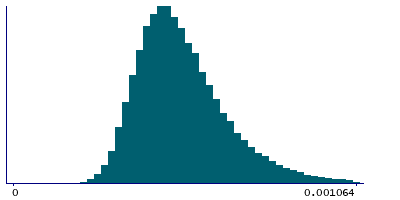
Instance 2 : Imaging visit (2014+)
60,187 participants, 60,187 items
| Maximum | 0.002834 |
| Decile 9 | 0.000716 |
| Decile 8 | 0.000629 |
| Decile 7 | 0.000576 |
| Decile 6 | 0.000536 |
| Median | 0.000502 |
| Decile 4 | 0.000471 |
| Decile 3 | 0.000441 |
| Decile 2 | 0.000409 |
| Decile 1 | 0.000368 |
| Minimum | 0 |
|
|
- Mean = 0.000527335
- Std.dev = 0.000147913
- 365 items above graph maximum of 0.001064
|
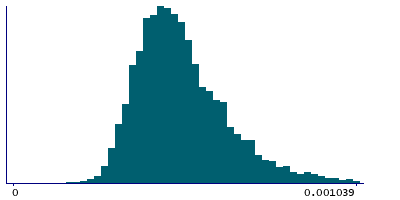
Instance 3 : First repeat imaging visit (2019+)
4,760 participants, 4,760 items
| Maximum | 0.001409 |
| Decile 9 | 0.000699 |
| Decile 8 | 0.000615 |
| Decile 7 | 0.00056 |
| Decile 6 | 0.00052 |
| Median | 0.000488 |
| Decile 4 | 0.000458 |
| Decile 3 | 0.000428 |
| Decile 2 | 0.000398 |
| Decile 1 | 0.000359 |
| Minimum | -0.000175 |
|
|
- Mean = 0.0005125
- Std.dev = 0.000142948
- 1 item below graph minimum of 0
- 22 items above graph maximum of 0.001039
|
Notes
Mean L3 in tapetum (left) on FA (fractional anisotropy) skeleton (from dMRI data)
0 Related Data-Fields
There are no related data-fields

