Data
83,906 items of data are available, covering 79,379 participants.
Defined-instances run from 2 to 3, labelled using Instancing
2.
Units of measurement are AU.
| Maximum | 0.99 |
| Decile 9 | 0.60456 |
| Decile 8 | 0.586115 |
| Decile 7 | 0.572294 |
| Decile 6 | 0.560461 |
| Median | 0.549022 |
| Decile 4 | 0.537295 |
| Decile 3 | 0.524234 |
| Decile 2 | 0.508203 |
| Decile 1 | 0.484484 |
| Minimum | 0.212975 |
|

|
- Mean = 0.546149
- Std.dev = 0.0488745
- 165 items below graph minimum of 0.364408
- 38 items above graph maximum of 0.724636
|
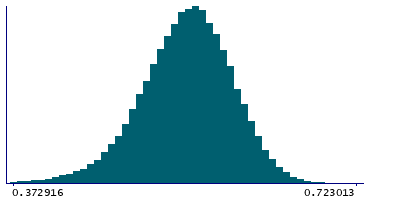
2 Instances
Instance 2 : Imaging visit (2014+)
79,148 participants, 79,148 items
| Maximum | 0.99 |
| Decile 9 | 0.604353 |
| Decile 8 | 0.58582 |
| Decile 7 | 0.571999 |
| Decile 6 | 0.560061 |
| Median | 0.548547 |
| Decile 4 | 0.536841 |
| Decile 3 | 0.523821 |
| Decile 2 | 0.507684 |
| Decile 1 | 0.483798 |
| Minimum | 0.212975 |
|
|
- Mean = 0.54571
- Std.dev = 0.0490367
- 154 items below graph minimum of 0.363243
- 34 items above graph maximum of 0.724908
|
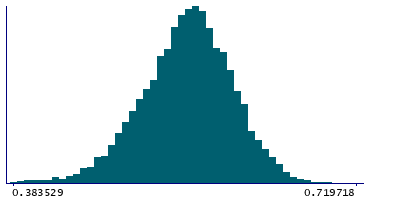
Instance 3 : First repeat imaging visit (2019+)
4,758 participants, 4,758 items
| Maximum | 0.956513 |
| Decile 9 | 0.607657 |
| Decile 8 | 0.590639 |
| Decile 7 | 0.577318 |
| Decile 6 | 0.56619 |
| Median | 0.555837 |
| Decile 4 | 0.545095 |
| Decile 3 | 0.533048 |
| Decile 2 | 0.517594 |
| Decile 1 | 0.495565 |
| Minimum | 0.298345 |
|
|
- Mean = 0.553457
- Std.dev = 0.0454745
- 5 items below graph minimum of 0.383474
- 3 items above graph maximum of 0.719749
|
Notes
Mean ICVF (intra-cellular volume fraction) in anterior corona radiata (left) on FA (fractional anisotropy) skeleton (from dMRI data)
0 Related Data-Fields
There are no related data-fields

