Data
83,906 items of data are available, covering 79,379 participants.
Defined-instances run from 2 to 3, labelled using Instancing
2.
Units of measurement are AU.
| Maximum | 0.99 |
| Decile 9 | 0.694577 |
| Decile 8 | 0.680349 |
| Decile 7 | 0.66969 |
| Decile 6 | 0.660272 |
| Median | 0.651456 |
| Decile 4 | 0.642119 |
| Decile 3 | 0.631777 |
| Decile 2 | 0.618893 |
| Decile 1 | 0.598774 |
| Minimum | 0.308647 |
|
|
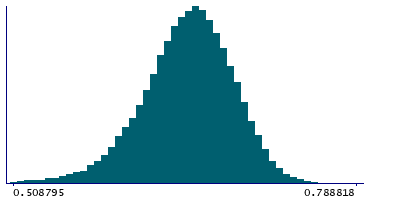
- Mean = 0.64813
- Std.dev = 0.0405804
- 433 items below graph minimum of 0.502972
- 35 items above graph maximum of 0.79038
|
2 Instances
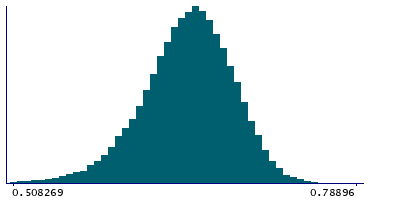
Instance 2 : Imaging visit (2014+)
79,148 participants, 79,148 items
| Maximum | 0.99 |
| Decile 9 | 0.694449 |
| Decile 8 | 0.680242 |
| Decile 7 | 0.669539 |
| Decile 6 | 0.660122 |
| Median | 0.651282 |
| Decile 4 | 0.641888 |
| Decile 3 | 0.631501 |
| Decile 2 | 0.618561 |
| Decile 1 | 0.598262 |
| Minimum | 0.308647 |
|
|
- Mean = 0.647889
- Std.dev = 0.0407136
- 412 items below graph minimum of 0.502074
- 32 items above graph maximum of 0.790637
|
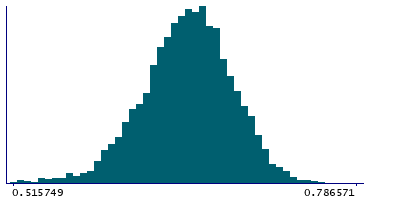
Instance 3 : First repeat imaging visit (2019+)
4,758 participants, 4,758 items
| Maximum | 0.984201 |
| Decile 9 | 0.696303 |
| Decile 8 | 0.681905 |
| Decile 7 | 0.671888 |
| Decile 6 | 0.662808 |
| Median | 0.654074 |
| Decile 4 | 0.645615 |
| Decile 3 | 0.635786 |
| Decile 2 | 0.624579 |
| Decile 1 | 0.606022 |
| Minimum | 0.321467 |
|
|
- Mean = 0.652137
- Std.dev = 0.0380723
- 22 items below graph minimum of 0.515742
- 3 items above graph maximum of 0.786583
|
Notes
Mean ICVF (intra-cellular volume fraction) in superior corona radiata (right) on FA (fractional anisotropy) skeleton (from dMRI data)
0 Related Data-Fields
There are no related data-fields

