Data
64,942 items of data are available, covering 60,414 participants.
Defined-instances run from 2 to 3, labelled using Instancing
2.
Units of measurement are AU.
| Maximum | 0.99 |
| Decile 9 | 0.616389 |
| Decile 8 | 0.601228 |
| Decile 7 | 0.591067 |
| Decile 6 | 0.582044 |
| Median | 0.573701 |
| Decile 4 | 0.565402 |
| Decile 3 | 0.556621 |
| Decile 2 | 0.546257 |
| Decile 1 | 0.531783 |
| Minimum | 0 |
|
|
- Mean = 0.574088
- Std.dev = 0.0349041
- 27 items below graph minimum of 0.447177
- 57 items above graph maximum of 0.700994
|
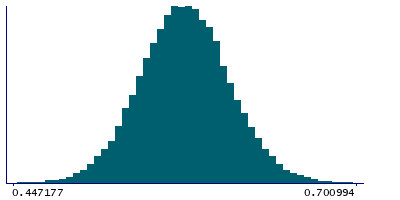
2 Instances
Instance 2 : Imaging visit (2014+)
60,182 participants, 60,182 items
| Maximum | 0.99 |
| Decile 9 | 0.616045 |
| Decile 8 | 0.600827 |
| Decile 7 | 0.59072 |
| Decile 6 | 0.581694 |
| Median | 0.573355 |
| Decile 4 | 0.564952 |
| Decile 3 | 0.556145 |
| Decile 2 | 0.545843 |
| Decile 1 | 0.531308 |
| Minimum | 0 |
|

|
- Mean = 0.573669
- Std.dev = 0.0349733
- 25 items below graph minimum of 0.446572
- 53 items above graph maximum of 0.700781
|
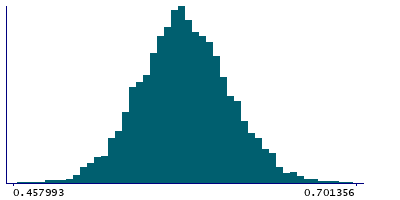
Instance 3 : First repeat imaging visit (2019+)
4,760 participants, 4,760 items
| Maximum | 0.9785 |
| Decile 9 | 0.620235 |
| Decile 8 | 0.605603 |
| Decile 7 | 0.595538 |
| Decile 6 | 0.586481 |
| Median | 0.578504 |
| Decile 4 | 0.571053 |
| Decile 3 | 0.562523 |
| Decile 2 | 0.552377 |
| Decile 1 | 0.539114 |
| Minimum | 0.411489 |
|
|
- Mean = 0.579385
- Std.dev = 0.0335689
- 2 items below graph minimum of 0.457993
- 4 items above graph maximum of 0.701356
|
Notes
Mean ICVF (intra-cellular volume fraction) in fornix cres+stria terminalis (left) on FA (fractional anisotropy) skeleton (from dMRI data)
0 Related Data-Fields
There are no related data-fields

