Data
83,906 items of data are available, covering 79,379 participants.
Defined-instances run from 2 to 3, labelled using Instancing
2.
Units of measurement are AU.
| Maximum | 0.99 |
| Decile 9 | 0.66293 |
| Decile 8 | 0.644264 |
| Decile 7 | 0.630151 |
| Decile 6 | 0.617531 |
| Median | 0.605042 |
| Decile 4 | 0.591789 |
| Decile 3 | 0.576074 |
| Decile 2 | 0.555229 |
| Decile 1 | 0.517622 |
| Minimum | 0 |
|
|
- Mean = 0.595509
- Std.dev = 0.0640246
- 741 items below graph minimum of 0.372314
- 34 items above graph maximum of 0.808238
|
2 Instances
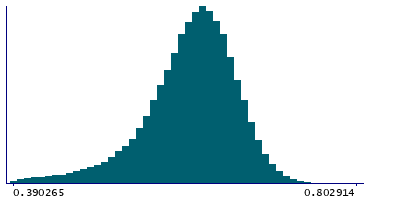
Instance 2 : Imaging visit (2014+)
79,148 participants, 79,148 items
| Maximum | 0.99 |
| Decile 9 | 0.662817 |
| Decile 8 | 0.644056 |
| Decile 7 | 0.629785 |
| Decile 6 | 0.617163 |
| Median | 0.604609 |
| Decile 4 | 0.591288 |
| Decile 3 | 0.575416 |
| Decile 2 | 0.554369 |
| Decile 1 | 0.516658 |
| Minimum | 0 |
|

|
- Mean = 0.594977
- Std.dev = 0.0643422
- 696 items below graph minimum of 0.370499
- 31 items above graph maximum of 0.808976
|
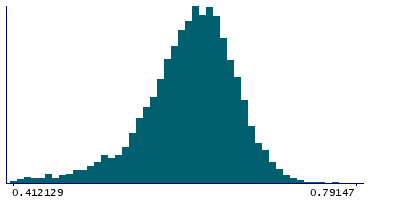
Instance 3 : First repeat imaging visit (2019+)
4,758 participants, 4,758 items
| Maximum | 0.988815 |
| Decile 9 | 0.665029 |
| Decile 8 | 0.647508 |
| Decile 7 | 0.634439 |
| Decile 6 | 0.623409 |
| Median | 0.611889 |
| Decile 4 | 0.599692 |
| Decile 3 | 0.586195 |
| Decile 2 | 0.568691 |
| Decile 1 | 0.538508 |
| Minimum | 0.190084 |
|
|
- Mean = 0.604363
- Std.dev = 0.0577742
- 54 items below graph minimum of 0.411987
- 3 items above graph maximum of 0.791549
|
Notes
Mean ICVF (intra-cellular volume fraction) in superior fronto-occipital fasciculus (right) on FA (fractional anisotropy) skeleton (from dMRI data)
0 Related Data-Fields
There are no related data-fields

