Data
83,906 items of data are available, covering 79,379 participants.
Defined-instances run from 2 to 3, labelled using Instancing
2.
Units of measurement are AU.
| Maximum | 0.99 |
| Decile 9 | 0.542243 |
| Decile 8 | 0.528755 |
| Decile 7 | 0.51916 |
| Decile 6 | 0.511065 |
| Median | 0.503482 |
| Decile 4 | 0.495852 |
| Decile 3 | 0.487604 |
| Decile 2 | 0.47787 |
| Decile 1 | 0.46428 |
| Minimum | 0 |
|

|
- Mean = 0.503426
- Std.dev = 0.0322202
- 65 items below graph minimum of 0.386317
- 80 items above graph maximum of 0.620206
|
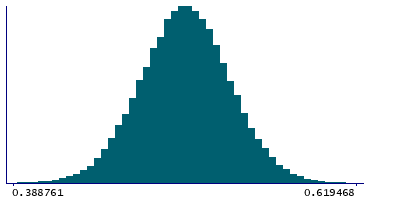
2 Instances
Instance 2 : Imaging visit (2014+)
79,148 participants, 79,148 items
| Maximum | 0.99 |
| Decile 9 | 0.541829 |
| Decile 8 | 0.528361 |
| Decile 7 | 0.518741 |
| Decile 6 | 0.510647 |
| Median | 0.503062 |
| Decile 4 | 0.495407 |
| Decile 3 | 0.487176 |
| Decile 2 | 0.477386 |
| Decile 1 | 0.463784 |
| Minimum | 0 |
|
|
- Mean = 0.502999
- Std.dev = 0.0321984
- 59 items below graph minimum of 0.38574
- 77 items above graph maximum of 0.619874
|
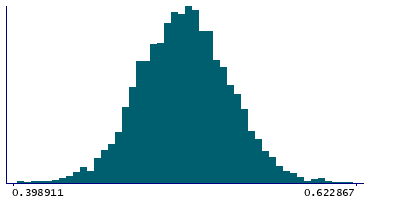
Instance 3 : First repeat imaging visit (2019+)
4,758 participants, 4,758 items
| Maximum | 0.91153 |
| Decile 9 | 0.548223 |
| Decile 8 | 0.535244 |
| Decile 7 | 0.525788 |
| Decile 6 | 0.517719 |
| Median | 0.510392 |
| Decile 4 | 0.503095 |
| Decile 3 | 0.494777 |
| Decile 2 | 0.485345 |
| Decile 1 | 0.47355 |
| Minimum | 0.240112 |
|
|
- Mean = 0.510536
- Std.dev = 0.0317473
- 6 items below graph minimum of 0.398876
- 4 items above graph maximum of 0.622896
|
Notes
Mean ICVF (intra-cellular volume fraction) in uncinate fasciculus (right) on FA (fractional anisotropy) skeleton (from dMRI data)
0 Related Data-Fields
There are no related data-fields

