Data
83,906 items of data are available, covering 79,379 participants.
Defined-instances run from 2 to 3, labelled using Instancing
2.
Units of measurement are AU.
| Maximum | 0.589489 |
| Decile 9 | 0.201964 |
| Decile 8 | 0.185346 |
| Decile 7 | 0.173496 |
| Decile 6 | 0.16333 |
| Median | 0.154487 |
| Decile 4 | 0.146456 |
| Decile 3 | 0.138503 |
| Decile 2 | 0.130202 |
| Decile 1 | 0.120066 |
| Minimum | 0 |
|
|
- Mean = 0.158369
- Std.dev = 0.0321969
- 66 items above graph maximum of 0.283861
|
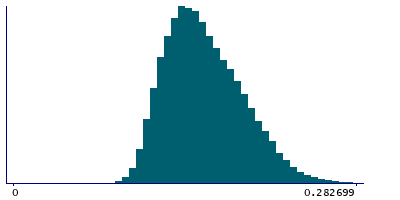
2 Instances
Instance 2 : Imaging visit (2014+)
79,148 participants, 79,148 items
| Maximum | 0.589489 |
| Decile 9 | 0.202028 |
| Decile 8 | 0.185397 |
| Decile 7 | 0.173647 |
| Decile 6 | 0.163446 |
| Median | 0.15463 |
| Decile 4 | 0.146619 |
| Decile 3 | 0.138659 |
| Decile 2 | 0.130325 |
| Decile 1 | 0.120157 |
| Minimum | 0 |
|

|
- Mean = 0.158481
- Std.dev = 0.0321406
- 60 items above graph maximum of 0.283898
|
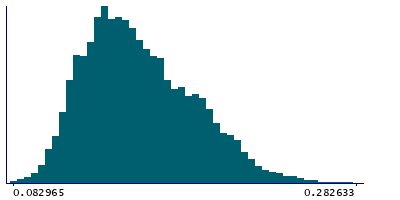
Instance 3 : First repeat imaging visit (2019+)
4,758 participants, 4,758 items
| Maximum | 0.576838 |
| Decile 9 | 0.200453 |
| Decile 8 | 0.184281 |
| Decile 7 | 0.171017 |
| Decile 6 | 0.160975 |
| Median | 0.151837 |
| Decile 4 | 0.143951 |
| Decile 3 | 0.136165 |
| Decile 2 | 0.128207 |
| Decile 1 | 0.118344 |
| Minimum | 0.082965 |
|
|
- Mean = 0.156509
- Std.dev = 0.0330632
- 6 items above graph maximum of 0.282562
|
Notes
Mean OD (orientation dispersion index) in corticospinal tract (right) on FA (fractional anisotropy) skeleton (from dMRI data)
0 Related Data-Fields
There are no related data-fields

