Data
83,906 items of data are available, covering 79,379 participants.
Defined-instances run from 2 to 3, labelled using Instancing
2.
Units of measurement are AU.
| Maximum | 0.557443 |
| Decile 9 | 0.184065 |
| Decile 8 | 0.169695 |
| Decile 7 | 0.159604 |
| Decile 6 | 0.151311 |
| Median | 0.143993 |
| Decile 4 | 0.137146 |
| Decile 3 | 0.130245 |
| Decile 2 | 0.122998 |
| Decile 1 | 0.114161 |
| Minimum | 0 |
|

|
- Mean = 0.147072
- Std.dev = 0.0279451
- 100 items above graph maximum of 0.253969
|
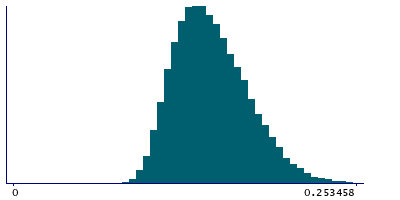
2 Instances
Instance 2 : Imaging visit (2014+)
79,148 participants, 79,148 items
| Maximum | 0.557443 |
| Decile 9 | 0.184165 |
| Decile 8 | 0.16978 |
| Decile 7 | 0.159737 |
| Decile 6 | 0.15146 |
| Median | 0.144116 |
| Decile 4 | 0.137242 |
| Decile 3 | 0.130346 |
| Decile 2 | 0.123119 |
| Decile 1 | 0.114248 |
| Minimum | 0 |
|
|
- Mean = 0.147168
- Std.dev = 0.0278914
- 90 items above graph maximum of 0.254081
|
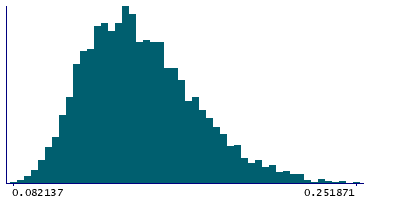
Instance 3 : First repeat imaging visit (2019+)
4,758 participants, 4,758 items
| Maximum | 0.487694 |
| Decile 9 | 0.182443 |
| Decile 8 | 0.167371 |
| Decile 7 | 0.157286 |
| Decile 6 | 0.149475 |
| Median | 0.141801 |
| Decile 4 | 0.13558 |
| Decile 3 | 0.128244 |
| Decile 2 | 0.121364 |
| Decile 1 | 0.113034 |
| Minimum | 0.082137 |
|
|
- Mean = 0.145473
- Std.dev = 0.0287768
- 12 items above graph maximum of 0.251851
|
Notes
Mean OD (orientation dispersion index) in corticospinal tract (left) on FA (fractional anisotropy) skeleton (from dMRI data)
0 Related Data-Fields
There are no related data-fields

