Data
64,942 items of data are available, covering 60,414 participants.
Defined-instances run from 2 to 3, labelled using Instancing
2.
Units of measurement are AU.
| Maximum | 0.557323 |
| Decile 9 | 0.0910695 |
| Decile 8 | 0.087299 |
| Decile 7 | 0.08475 |
| Decile 6 | 0.082689 |
| Median | 0.080794 |
| Decile 4 | 0.079 |
| Decile 3 | 0.0771195 |
| Decile 2 | 0.0750125 |
| Decile 1 | 0.072125 |
| Minimum | 0 |
|
|
- Mean = 0.0815077
- Std.dev = 0.0101374
- 3 items below graph minimum of 0.0531805
- 221 items above graph maximum of 0.110014
|
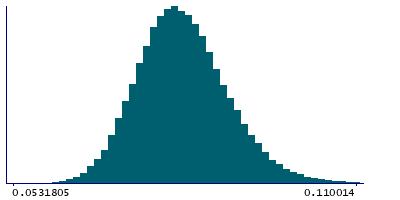
2 Instances
Instance 2 : Imaging visit (2014+)
60,182 participants, 60,182 items
| Maximum | 0.557323 |
| Decile 9 | 0.090938 |
| Decile 8 | 0.0871965 |
| Decile 7 | 0.084648 |
| Decile 6 | 0.0825815 |
| Median | 0.080696 |
| Decile 4 | 0.078894 |
| Decile 3 | 0.077023 |
| Decile 2 | 0.074917 |
| Decile 1 | 0.072045 |
| Minimum | 0 |
|

|
- Mean = 0.0814023
- Std.dev = 0.0100472
- 3 items below graph minimum of 0.053152
- 205 items above graph maximum of 0.109831
|
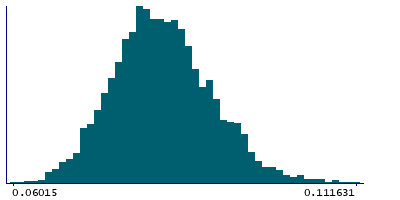
Instance 3 : First repeat imaging visit (2019+)
4,760 participants, 4,760 items
| Maximum | 0.520106 |
| Decile 9 | 0.092473 |
| Decile 8 | 0.088722 |
| Decile 7 | 0.086056 |
| Decile 6 | 0.084063 |
| Median | 0.082145 |
| Decile 4 | 0.080249 |
| Decile 3 | 0.078442 |
| Decile 2 | 0.076352 |
| Decile 1 | 0.073315 |
| Minimum | 0.06015 |
|
|
- Mean = 0.0828412
- Std.dev = 0.0111295
- 16 items above graph maximum of 0.111631
|
Notes
Mean OD (orientation dispersion index) in superior cerebellar peduncle (right) on FA (fractional anisotropy) skeleton (from dMRI data)
0 Related Data-Fields
There are no related data-fields

