Data
64,942 items of data are available, covering 60,414 participants.
Defined-instances run from 2 to 3, labelled using Instancing
2.
Units of measurement are AU.
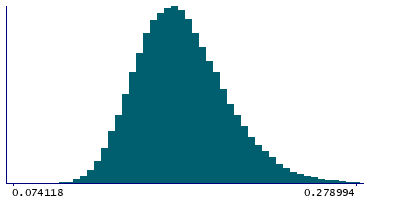
| Maximum | 0.695361 |
| Decile 9 | 0.210702 |
| Decile 8 | 0.19647 |
| Decile 7 | 0.187011 |
| Decile 6 | 0.179286 |
| Median | 0.172525 |
| Decile 4 | 0.166021 |
| Decile 3 | 0.159262 |
| Decile 2 | 0.151993 |
| Decile 1 | 0.14241 |
| Minimum | 0 |
|
|
- Mean = 0.175107
- Std.dev = 0.0281435
- 3 items below graph minimum of 0.074118
- 142 items above graph maximum of 0.278994
|
2 Instances
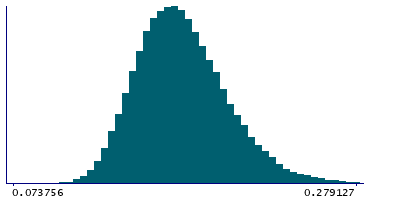
Instance 2 : Imaging visit (2014+)
60,182 participants, 60,182 items
| Maximum | 0.695361 |
| Decile 9 | 0.21067 |
| Decile 8 | 0.19637 |
| Decile 7 | 0.186902 |
| Decile 6 | 0.179142 |
| Median | 0.172316 |
| Decile 4 | 0.165796 |
| Decile 3 | 0.159066 |
| Decile 2 | 0.15177 |
| Decile 1 | 0.142213 |
| Minimum | 0 |
|
|
- Mean = 0.174955
- Std.dev = 0.0281683
- 3 items below graph minimum of 0.073756
- 134 items above graph maximum of 0.279127
|
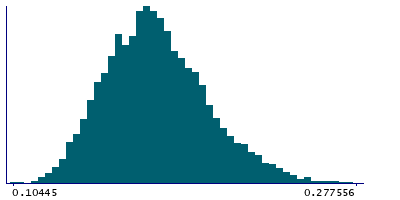
Instance 3 : First repeat imaging visit (2019+)
4,760 participants, 4,760 items
| Maximum | 0.584967 |
| Decile 9 | 0.211324 |
| Decile 8 | 0.197658 |
| Decile 7 | 0.188542 |
| Decile 6 | 0.180985 |
| Median | 0.174788 |
| Decile 4 | 0.168877 |
| Decile 3 | 0.162102 |
| Decile 2 | 0.154647 |
| Decile 1 | 0.145092 |
| Minimum | 0.10445 |
|
|
- Mean = 0.177035
- Std.dev = 0.0277549
- 8 items above graph maximum of 0.277556
|
Notes
Mean OD (orientation dispersion index) in cingulum hippocampus (right) on FA (fractional anisotropy) skeleton (from dMRI data)
0 Related Data-Fields
There are no related data-fields

