Data
83,906 items of data are available, covering 79,379 participants.
Defined-instances run from 2 to 3, labelled using Instancing
2.
Units of measurement are AU.
| Maximum | 0.561333 |
| Decile 9 | 0.166384 |
| Decile 8 | 0.154358 |
| Decile 7 | 0.146827 |
| Decile 6 | 0.140791 |
| Median | 0.135611 |
| Decile 4 | 0.130767 |
| Decile 3 | 0.125783 |
| Decile 2 | 0.120289 |
| Decile 1 | 0.113259 |
| Minimum | 0 |
|

|
- Mean = 0.13887
- Std.dev = 0.0245067
- 3 items below graph minimum of 0.0601345
- 839 items above graph maximum of 0.219508
|
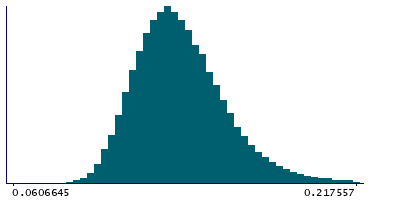
2 Instances
Instance 2 : Imaging visit (2014+)
79,148 participants, 79,148 items
| Maximum | 0.561333 |
| Decile 9 | 0.166363 |
| Decile 8 | 0.154305 |
| Decile 7 | 0.146769 |
| Decile 6 | 0.140715 |
| Median | 0.135509 |
| Decile 4 | 0.130657 |
| Decile 3 | 0.125682 |
| Decile 2 | 0.120184 |
| Decile 1 | 0.113176 |
| Minimum | 0 |
|
|
- Mean = 0.138799
- Std.dev = 0.0245366
- 3 items below graph minimum of 0.0599905
- 799 items above graph maximum of 0.219549
|
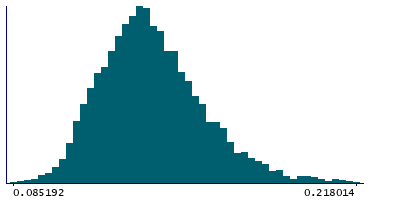
Instance 3 : First repeat imaging visit (2019+)
4,758 participants, 4,758 items
| Maximum | 0.491082 |
| Decile 9 | 0.166586 |
| Decile 8 | 0.155062 |
| Decile 7 | 0.147695 |
| Decile 6 | 0.141975 |
| Median | 0.136935 |
| Decile 4 | 0.132588 |
| Decile 3 | 0.127685 |
| Decile 2 | 0.122138 |
| Decile 1 | 0.115126 |
| Minimum | 0.085192 |
|
|
- Mean = 0.140042
- Std.dev = 0.0239735
- 41 items above graph maximum of 0.218048
|
Notes
Mean OD (orientation dispersion index) in fornix cres+stria terminalis (right) on FA (fractional anisotropy) skeleton (from dMRI data)
0 Related Data-Fields
There are no related data-fields

