Data
83,906 items of data are available, covering 79,379 participants.
Defined-instances run from 2 to 3, labelled using Instancing
2.
Units of measurement are AU.
| Maximum | 0.999765 |
| Decile 9 | 0.0939265 |
| Decile 8 | 0.083761 |
| Decile 7 | 0.077344 |
| Decile 6 | 0.072455 |
| Median | 0.068127 |
| Decile 4 | 0.0641255 |
| Decile 3 | 0.060219 |
| Decile 2 | 0.0559335 |
| Decile 1 | 0.0506795 |
| Minimum | 0 |
|
|
- Mean = 0.0711132
- Std.dev = 0.0212207
- 576 items above graph maximum of 0.137174
|
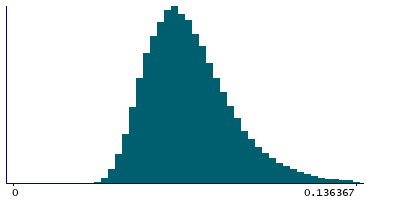
2 Instances
Instance 2 : Imaging visit (2014+)
79,148 participants, 79,148 items
| Maximum | 0.999765 |
| Decile 9 | 0.093934 |
| Decile 8 | 0.0837215 |
| Decile 7 | 0.077292 |
| Decile 6 | 0.072404 |
| Median | 0.068068 |
| Decile 4 | 0.064066 |
| Decile 3 | 0.060168 |
| Decile 2 | 0.0558895 |
| Decile 1 | 0.050616 |
| Minimum | 0 |
|

|
- Mean = 0.071068
- Std.dev = 0.0212484
- 535 items above graph maximum of 0.137252
|
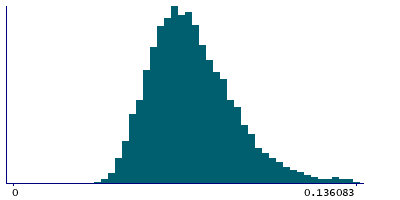
Instance 3 : First repeat imaging visit (2019+)
4,758 participants, 4,758 items
| Maximum | 0.696755 |
| Decile 9 | 0.0938535 |
| Decile 8 | 0.084258 |
| Decile 7 | 0.078199 |
| Decile 6 | 0.0731855 |
| Median | 0.06909 |
| Decile 4 | 0.0651285 |
| Decile 3 | 0.0610975 |
| Decile 2 | 0.056947 |
| Decile 1 | 0.0515945 |
| Minimum | 0.032915 |
|
|
- Mean = 0.0718651
- Std.dev = 0.0207392
- 40 items above graph maximum of 0.136113
|
Notes
Mean OD (orientation dispersion index) in tapetum (right) on FA (fractional anisotropy) skeleton (from dMRI data)
0 Related Data-Fields
There are no related data-fields

