Data
83,906 items of data are available, covering 79,379 participants.
Defined-instances run from 2 to 3, labelled using Instancing
2.
Units of measurement are AU.
| Maximum | 1 |
| Decile 9 | 0.0971695 |
| Decile 8 | 0.0833005 |
| Decile 7 | 0.074797 |
| Decile 6 | 0.0682295 |
| Median | 0.062702 |
| Decile 4 | 0.057853 |
| Decile 3 | 0.053322 |
| Decile 2 | 0.0489015 |
| Decile 1 | 0.0439035 |
| Minimum | 0 |
|
|
- Mean = 0.0676256
- Std.dev = 0.0245433
- 518 items above graph maximum of 0.150435
|
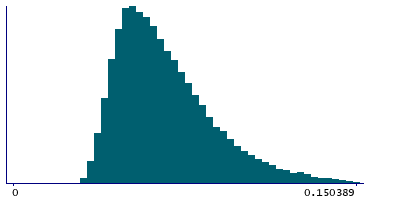
2 Instances
Instance 2 : Imaging visit (2014+)
79,148 participants, 79,148 items
| Maximum | 1 |
| Decile 9 | 0.097044 |
| Decile 8 | 0.083136 |
| Decile 7 | 0.0746345 |
| Decile 6 | 0.0680925 |
| Median | 0.062609 |
| Decile 4 | 0.057739 |
| Decile 3 | 0.053223 |
| Decile 2 | 0.048808 |
| Decile 1 | 0.0438295 |
| Minimum | 0 |
|

|
- Mean = 0.0675122
- Std.dev = 0.0245276
- 487 items above graph maximum of 0.150259
|
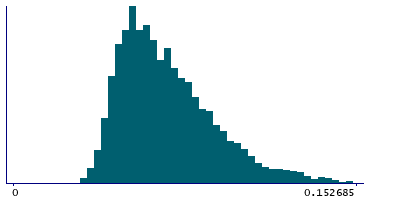
Instance 3 : First repeat imaging visit (2019+)
4,758 participants, 4,758 items
| Maximum | 0.713036 |
| Decile 9 | 0.0991545 |
| Decile 8 | 0.0857455 |
| Decile 7 | 0.077123 |
| Decile 6 | 0.0702595 |
| Median | 0.064712 |
| Decile 4 | 0.0595615 |
| Decile 3 | 0.05474 |
| Decile 2 | 0.0505615 |
| Decile 1 | 0.045544 |
| Minimum | 0.030638 |
|
|
- Mean = 0.0695122
- Std.dev = 0.0247259
- 37 items above graph maximum of 0.152765
|
Notes
Mean OD (orientation dispersion index) in tapetum (left) on FA (fractional anisotropy) skeleton (from dMRI data)
0 Related Data-Fields
There are no related data-fields

