Data
64,945 items of data are available, covering 60,417 participants.
Defined-instances run from 2 to 3, labelled using Instancing
2.
Units of measurement are AU.
| Maximum | 0.488765 |
| Decile 9 | 0.41953 |
| Decile 8 | 0.411774 |
| Decile 7 | 0.406161 |
| Decile 6 | 0.401426 |
| Median | 0.396817 |
| Decile 4 | 0.392161 |
| Decile 3 | 0.386999 |
| Decile 2 | 0.380873 |
| Decile 1 | 0.371673 |
| Minimum | 0 |
|

|
- Mean = 0.395854
- Std.dev = 0.0204631
- 113 items below graph minimum of 0.323816
- 3 items above graph maximum of 0.467387
|
2 Instances
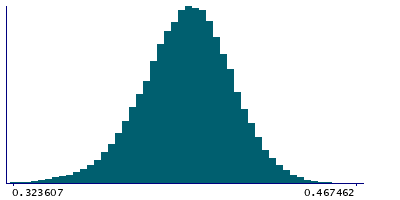
Instance 2 : Imaging visit (2014+)
60,185 participants, 60,185 items
| Maximum | 0.488765 |
| Decile 9 | 0.41951 |
| Decile 8 | 0.411783 |
| Decile 7 | 0.406159 |
| Decile 6 | 0.401398 |
| Median | 0.396785 |
| Decile 4 | 0.392146 |
| Decile 3 | 0.38696 |
| Decile 2 | 0.380827 |
| Decile 1 | 0.371559 |
| Minimum | 0 |
|
|
- Mean = 0.395827
- Std.dev = 0.0204748
- 106 items below graph minimum of 0.323607
- 3 items above graph maximum of 0.467462
|
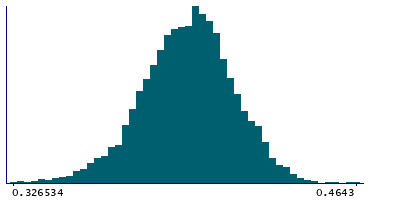
Instance 3 : First repeat imaging visit (2019+)
4,760 participants, 4,760 items
| Maximum | 0.4643 |
| Decile 9 | 0.419734 |
| Decile 8 | 0.41152 |
| Decile 7 | 0.406182 |
| Decile 6 | 0.401658 |
| Median | 0.397358 |
| Decile 4 | 0.392322 |
| Decile 3 | 0.387345 |
| Decile 2 | 0.381447 |
| Decile 1 | 0.373134 |
| Minimum | 0 |
|
|
- Mean = 0.396194
- Std.dev = 0.0203118
- 8 items below graph minimum of 0.326534
|
Notes
Weighted-mean FA (fractional anisotropy) in tract left anterior thalamic radiation (from dMRI data)
0 Related Data-Fields
There are no related data-fields

