Data
64,945 items of data are available, covering 60,417 participants.
Defined-instances run from 2 to 3, labelled using Instancing
2.
Units of measurement are AU.
| Maximum | 0.642451 |
| Decile 9 | 0.516116 |
| Decile 8 | 0.504273 |
| Decile 7 | 0.495873 |
| Decile 6 | 0.48864 |
| Median | 0.482033 |
| Decile 4 | 0.475299 |
| Decile 3 | 0.468176 |
| Decile 2 | 0.459726 |
| Decile 1 | 0.447706 |
| Minimum | 0 |
|

|
- Mean = 0.481608
- Std.dev = 0.0304158
- 140 items below graph minimum of 0.379296
- 49 items above graph maximum of 0.584526
|
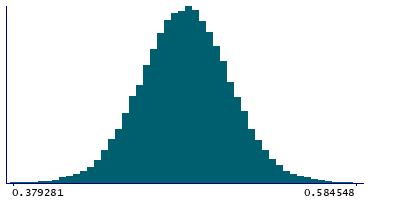
2 Instances
Instance 2 : Imaging visit (2014+)
60,185 participants, 60,185 items
| Maximum | 0.642451 |
| Decile 9 | 0.516126 |
| Decile 8 | 0.504322 |
| Decile 7 | 0.495948 |
| Decile 6 | 0.488703 |
| Median | 0.482122 |
| Decile 4 | 0.475366 |
| Decile 3 | 0.468206 |
| Decile 2 | 0.459745 |
| Decile 1 | 0.447703 |
| Minimum | 0 |
|
|
- Mean = 0.481614
- Std.dev = 0.0304677
- 137 items below graph minimum of 0.379281
- 48 items above graph maximum of 0.584548
|
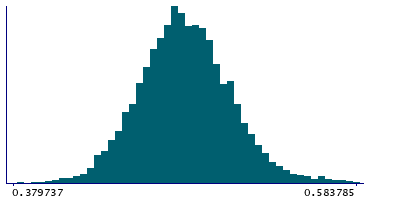
Instance 3 : First repeat imaging visit (2019+)
4,760 participants, 4,760 items
| Maximum | 0.587074 |
| Decile 9 | 0.515769 |
| Decile 8 | 0.503576 |
| Decile 7 | 0.494824 |
| Decile 6 | 0.487733 |
| Median | 0.480836 |
| Decile 4 | 0.474762 |
| Decile 3 | 0.467832 |
| Decile 2 | 0.459638 |
| Decile 1 | 0.447753 |
| Minimum | 0 |
|
|
- Mean = 0.481532
- Std.dev = 0.0297514
- 3 items below graph minimum of 0.379737
- 1 item above graph maximum of 0.583785
|
Notes
Weighted-mean FA (fractional anisotropy) in tract middle cerebellar peduncle (from dMRI data)
0 Related Data-Fields
There are no related data-fields

