Data
83,909 items of data are available, covering 79,382 participants.
Defined-instances run from 2 to 3, labelled using Instancing
2.
Units of measurement are AU.
| Maximum | 0.701469 |
| Decile 9 | 0.449043 |
| Decile 8 | 0.44059 |
| Decile 7 | 0.434354 |
| Decile 6 | 0.429013 |
| Median | 0.423893 |
| Decile 4 | 0.418732 |
| Decile 3 | 0.412967 |
| Decile 2 | 0.406086 |
| Decile 1 | 0.395786 |
| Minimum | 0 |
|

|
- Mean = 0.422866
- Std.dev = 0.021633
- 182 items below graph minimum of 0.342528
- 6 items above graph maximum of 0.502301
|
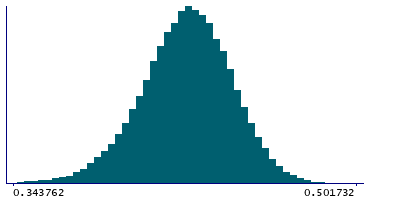
2 Instances
Instance 2 : Imaging visit (2014+)
79,151 participants, 79,151 items
| Maximum | 0.701469 |
| Decile 9 | 0.448939 |
| Decile 8 | 0.440512 |
| Decile 7 | 0.434284 |
| Decile 6 | 0.428903 |
| Median | 0.423798 |
| Decile 4 | 0.418626 |
| Decile 3 | 0.41285 |
| Decile 2 | 0.405944 |
| Decile 1 | 0.395624 |
| Minimum | 0 |
|
|
- Mean = 0.422746
- Std.dev = 0.0216883
- 175 items below graph minimum of 0.342308
- 5 items above graph maximum of 0.502255
|
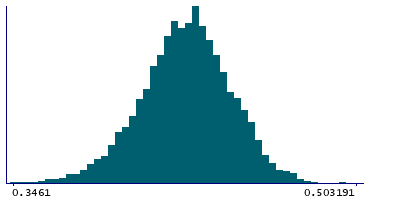
Instance 3 : First repeat imaging visit (2019+)
4,758 participants, 4,758 items
| Maximum | 0.506049 |
| Decile 9 | 0.450841 |
| Decile 8 | 0.441924 |
| Decile 7 | 0.435562 |
| Decile 6 | 0.430361 |
| Median | 0.425748 |
| Decile 4 | 0.420387 |
| Decile 3 | 0.415261 |
| Decile 2 | 0.408542 |
| Decile 1 | 0.398434 |
| Minimum | 0.321328 |
|
|
- Mean = 0.424853
- Std.dev = 0.0205917
- 6 items below graph minimum of 0.346028
- 1 item above graph maximum of 0.503247
|
Notes
Weighted-mean FA (fractional anisotropy) in tract right superior longitudinal fasciculus (from dMRI data)
0 Related Data-Fields
There are no related data-fields

