Data
64,945 items of data are available, covering 60,417 participants.
Defined-instances run from 2 to 3, labelled using Instancing
2.
Units of measurement are AU.
| Maximum | 0.469062 |
| Decile 9 | 0.409598 |
| Decile 8 | 0.400629 |
| Decile 7 | 0.394168 |
| Decile 6 | 0.388492 |
| Median | 0.383251 |
| Decile 4 | 0.377984 |
| Decile 3 | 0.372261 |
| Decile 2 | 0.36558 |
| Decile 1 | 0.355939 |
| Minimum | 0 |
|

|
- Mean = 0.382847
- Std.dev = 0.021872
- 62 items below graph minimum of 0.302279
- 4 items above graph maximum of 0.463258
|
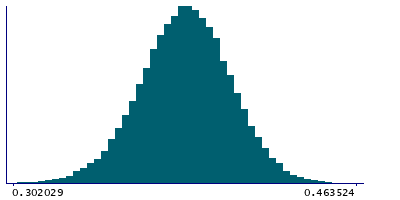
2 Instances
Instance 2 : Imaging visit (2014+)
60,185 participants, 60,185 items
| Maximum | 0.469062 |
| Decile 9 | 0.409692 |
| Decile 8 | 0.400655 |
| Decile 7 | 0.394227 |
| Decile 6 | 0.388521 |
| Median | 0.383282 |
| Decile 4 | 0.378013 |
| Decile 3 | 0.372268 |
| Decile 2 | 0.365549 |
| Decile 1 | 0.355861 |
| Minimum | 0 |
|
|
- Mean = 0.382847
- Std.dev = 0.0219775
- 61 items below graph minimum of 0.302029
- 3 items above graph maximum of 0.463524
|
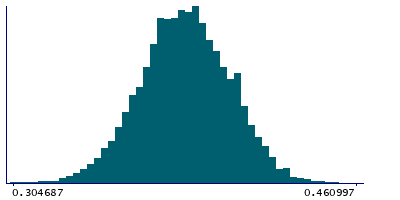
Instance 3 : First repeat imaging visit (2019+)
4,760 participants, 4,760 items
| Maximum | 0.468193 |
| Decile 9 | 0.408893 |
| Decile 8 | 0.400375 |
| Decile 7 | 0.393614 |
| Decile 6 | 0.388131 |
| Median | 0.382948 |
| Decile 4 | 0.377539 |
| Decile 3 | 0.372116 |
| Decile 2 | 0.366026 |
| Decile 1 | 0.35679 |
| Minimum | 0.262769 |
|
|
- Mean = 0.382855
- Std.dev = 0.0204923
- 2 items below graph minimum of 0.304687
- 1 item above graph maximum of 0.460997
|
Notes
Weighted-mean FA (fractional anisotropy) in tract right uncinate fasciculus (from dMRI data)
0 Related Data-Fields
There are no related data-fields

