Data
64,945 items of data are available, covering 60,417 participants.
Defined-instances run from 2 to 3, labelled using Instancing
2.
Units of measurement are AU.
| Maximum | 0.647345 |
| Decile 9 | 0.501245 |
| Decile 8 | 0.476247 |
| Decile 7 | 0.45817 |
| Decile 6 | 0.442259 |
| Median | 0.426607 |
| Decile 4 | 0.410933 |
| Decile 3 | 0.3929 |
| Decile 2 | 0.370964 |
| Decile 1 | 0.338416 |
| Minimum | 0 |
|

|
- Mean = 0.422223
- Std.dev = 0.0656857
- 117 items below graph minimum of 0.175586
|
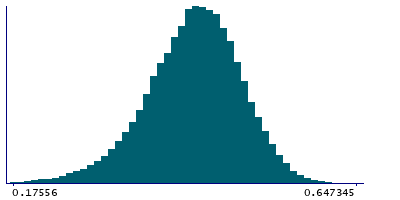
2 Instances
Instance 2 : Imaging visit (2014+)
60,185 participants, 60,185 items
| Maximum | 0.647345 |
| Decile 9 | 0.501569 |
| Decile 8 | 0.476599 |
| Decile 7 | 0.45849 |
| Decile 6 | 0.442548 |
| Median | 0.426968 |
| Decile 4 | 0.411307 |
| Decile 3 | 0.393263 |
| Decile 2 | 0.371191 |
| Decile 1 | 0.338564 |
| Minimum | 0 |
|
|
- Mean = 0.422519
- Std.dev = 0.0657053
- 107 items below graph minimum of 0.17556
|
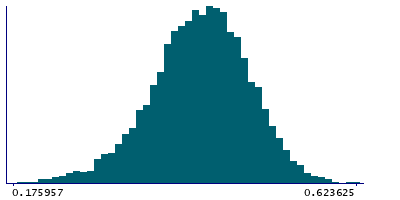
Instance 3 : First repeat imaging visit (2019+)
4,760 participants, 4,760 items
| Maximum | 0.623625 |
| Decile 9 | 0.497987 |
| Decile 8 | 0.472381 |
| Decile 7 | 0.453763 |
| Decile 6 | 0.437824 |
| Median | 0.421742 |
| Decile 4 | 0.405488 |
| Decile 3 | 0.388161 |
| Decile 2 | 0.368811 |
| Decile 1 | 0.336972 |
| Minimum | 0 |
|
|
- Mean = 0.418479
- Std.dev = 0.0653218
- 10 items below graph minimum of 0.175957
|
Notes
Weighted-mean MO (diffusion tensor mode) in tract left parahippocampal part of cingulum (from dMRI data)
0 Related Data-Fields
There are no related data-fields

