Data
83,909 items of data are available, covering 79,382 participants.
Defined-instances run from 2 to 3, labelled using Instancing
2.
Units of measurement are AU.
| Maximum | 0.497733 |
| Decile 9 | 0.365435 |
| Decile 8 | 0.346702 |
| Decile 7 | 0.333016 |
| Decile 6 | 0.321286 |
| Median | 0.30993 |
| Decile 4 | 0.298435 |
| Decile 3 | 0.286024 |
| Decile 2 | 0.271341 |
| Decile 1 | 0.25091 |
| Minimum | 0 |
|

|
- Mean = 0.308787
- Std.dev = 0.0446506
- 21 items below graph minimum of 0.136385
- 2 items above graph maximum of 0.47996
|
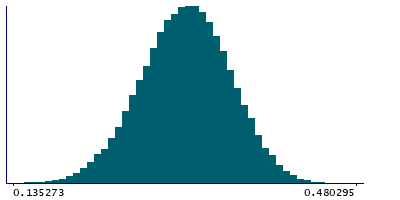
2 Instances
Instance 2 : Imaging visit (2014+)
79,151 participants, 79,151 items
| Maximum | 0.497733 |
| Decile 9 | 0.365519 |
| Decile 8 | 0.346796 |
| Decile 7 | 0.333122 |
| Decile 6 | 0.32139 |
| Median | 0.310015 |
| Decile 4 | 0.298541 |
| Decile 3 | 0.286081 |
| Decile 2 | 0.271444 |
| Decile 1 | 0.25098 |
| Minimum | 0 |
|
|
- Mean = 0.308879
- Std.dev = 0.044679
- 20 items below graph minimum of 0.13644
- 2 items above graph maximum of 0.480059
|
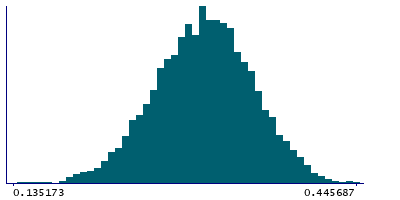
Instance 3 : First repeat imaging visit (2019+)
4,758 participants, 4,758 items
| Maximum | 0.445687 |
| Decile 9 | 0.363447 |
| Decile 8 | 0.344534 |
| Decile 7 | 0.330967 |
| Decile 6 | 0.319704 |
| Median | 0.308156 |
| Decile 4 | 0.296764 |
| Decile 3 | 0.284931 |
| Decile 2 | 0.270151 |
| Decile 1 | 0.249369 |
| Minimum | 0.117108 |
|
|
- Mean = 0.307269
- Std.dev = 0.0441485
- 1 item below graph minimum of 0.135291
|
Notes
Weighted-mean MO (diffusion tensor mode) in tract right superior longitudinal fasciculus (from dMRI data)
0 Related Data-Fields
There are no related data-fields

