Data
64,945 items of data are available, covering 60,417 participants.
Defined-instances run from 2 to 3, labelled using Instancing
2.
Units of measurement are AU.
| Maximum | 0.00185442 |
| Decile 9 | 0.00117805 |
| Decile 8 | 0.00115658 |
| Decile 7 | 0.00114286 |
| Decile 6 | 0.001132 |
| Median | 0.00112227 |
| Decile 4 | 0.00111324 |
| Decile 3 | 0.00110405 |
| Decile 2 | 0.00109368 |
| Decile 1 | 0.00107965 |
| Minimum | 0 |
|
|
- Mean = 0.00112619
- Std.dev = 4.41338e-05
- 53 items below graph minimum of 0.000981248
- 237 items above graph maximum of 0.00127645
|
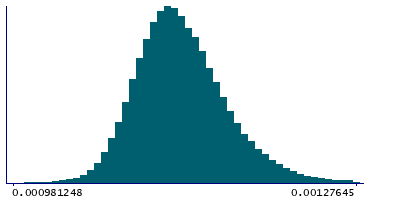
2 Instances
Instance 2 : Imaging visit (2014+)
60,185 participants, 60,185 items
| Maximum | 0.00173244 |
| Decile 9 | 0.00117832 |
| Decile 8 | 0.00115679 |
| Decile 7 | 0.00114307 |
| Decile 6 | 0.00113213 |
| Median | 0.00112237 |
| Decile 4 | 0.00111329 |
| Decile 3 | 0.00110404 |
| Decile 2 | 0.00109349 |
| Decile 1 | 0.00107941 |
| Minimum | 0 |
|

|
- Mean = 0.00112622
- Std.dev = 4.44704e-05
- 52 items below graph minimum of 0.000980507
- 217 items above graph maximum of 0.00127722
|
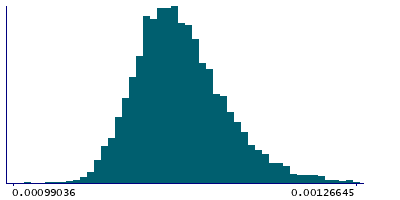
Instance 3 : First repeat imaging visit (2019+)
4,760 participants, 4,760 items
| Maximum | 0.00185442 |
| Decile 9 | 0.00117442 |
| Decile 8 | 0.00115388 |
| Decile 7 | 0.00114055 |
| Decile 6 | 0.00113043 |
| Median | 0.00112122 |
| Decile 4 | 0.00111272 |
| Decile 3 | 0.00110421 |
| Decile 2 | 0.00109529 |
| Decile 1 | 0.00108239 |
| Minimum | 0.000969238 |
|
|
- Mean = 0.0011259
- Std.dev = 3.96303e-05
- 1 item below graph minimum of 0.00099036
- 17 items above graph maximum of 0.00126645
|
Notes
Weighted-mean L1 in tract right superior thalamic radiation (from dMRI data)
0 Related Data-Fields
There are no related data-fields

