Data
64,945 items of data are available, covering 60,417 participants.
Defined-instances run from 2 to 3, labelled using Instancing
2.
Units of measurement are AU.
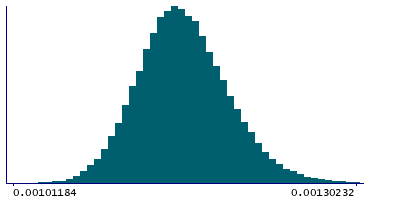
| Maximum | 0.00241736 |
| Decile 9 | 0.0012055 |
| Decile 8 | 0.00118679 |
| Decile 7 | 0.00117376 |
| Decile 6 | 0.00116333 |
| Median | 0.00115368 |
| Decile 4 | 0.00114446 |
| Decile 3 | 0.00113485 |
| Decile 2 | 0.00112391 |
| Decile 1 | 0.00110867 |
| Minimum | 0 |
|
|
- Mean = 0.00115581
- Std.dev = 4.29376e-05
- 15 items below graph minimum of 0.00101184
- 112 items above graph maximum of 0.00130232
|
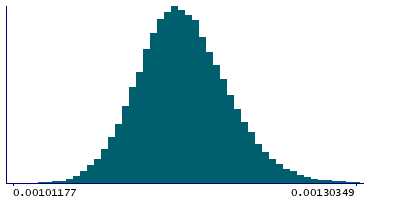
2 Instances
Instance 2 : Imaging visit (2014+)
60,185 participants, 60,185 items
| Maximum | 0.00241736 |
| Decile 9 | 0.00120625 |
| Decile 8 | 0.00118762 |
| Decile 7 | 0.00117461 |
| Decile 6 | 0.00116408 |
| Median | 0.00115444 |
| Decile 4 | 0.00114515 |
| Decile 3 | 0.00113546 |
| Decile 2 | 0.00112446 |
| Decile 1 | 0.00110901 |
| Minimum | 0 |
|
|
- Mean = 0.00115646
- Std.dev = 4.30509e-05
- 14 items below graph minimum of 0.00101177
- 104 items above graph maximum of 0.00130349
|
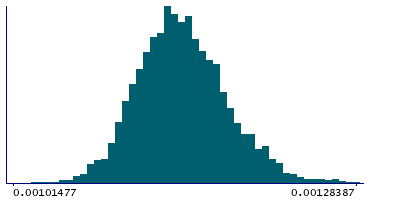
Instance 3 : First repeat imaging visit (2019+)
4,760 participants, 4,760 items
| Maximum | 0.00181058 |
| Decile 9 | 0.00119417 |
| Decile 8 | 0.00117545 |
| Decile 7 | 0.00116392 |
| Decile 6 | 0.00115376 |
| Median | 0.00114514 |
| Decile 4 | 0.00113683 |
| Decile 3 | 0.00112791 |
| Decile 2 | 0.00111787 |
| Decile 1 | 0.00110447 |
| Minimum | 0 |
|
|
- Mean = 0.00114752
- Std.dev = 4.05751e-05
- 1 item below graph minimum of 0.00101477
- 6 items above graph maximum of 0.00128387
|
Notes
Weighted-mean L1 in tract left uncinate fasciculus (from dMRI data)
0 Related Data-Fields
There are no related data-fields

