Data
83,909 items of data are available, covering 79,382 participants.
Defined-instances run from 2 to 3, labelled using Instancing
2.
Units of measurement are AU.
| Maximum | 0.00230669 |
| Decile 9 | 0.00121487 |
| Decile 8 | 0.00119715 |
| Decile 7 | 0.00118498 |
| Decile 6 | 0.00117523 |
| Median | 0.0011662 |
| Decile 4 | 0.00115748 |
| Decile 3 | 0.00114845 |
| Decile 2 | 0.00113796 |
| Decile 1 | 0.00112369 |
| Minimum | 0 |
|

|
- Mean = 0.00116814
- Std.dev = 3.98922e-05
- 18 items below graph minimum of 0.00103252
- 153 items above graph maximum of 0.00130604
|
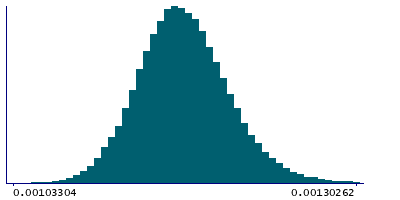
2 Instances
Instance 2 : Imaging visit (2014+)
79,151 participants, 79,151 items
| Maximum | 0.00230669 |
| Decile 9 | 0.00121559 |
| Decile 8 | 0.00119779 |
| Decile 7 | 0.00118568 |
| Decile 6 | 0.0011759 |
| Median | 0.00116683 |
| Decile 4 | 0.00115806 |
| Decile 3 | 0.00114907 |
| Decile 2 | 0.00113848 |
| Decile 1 | 0.00112422 |
| Minimum | 0 |
|
|
- Mean = 0.00116872
- Std.dev = 4.00208e-05
- 17 items below graph minimum of 0.00103285
- 149 items above graph maximum of 0.00130697
|
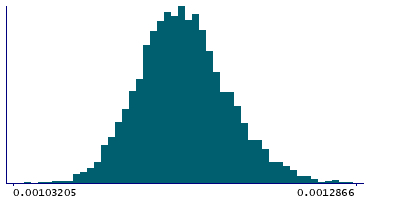
Instance 3 : First repeat imaging visit (2019+)
4,758 participants, 4,758 items
| Maximum | 0.00209361 |
| Decile 9 | 0.00120175 |
| Decile 8 | 0.00118485 |
| Decile 7 | 0.0011737 |
| Decile 6 | 0.00116512 |
| Median | 0.00115697 |
| Decile 4 | 0.00114842 |
| Decile 3 | 0.00114002 |
| Decile 2 | 0.00113062 |
| Decile 1 | 0.00111686 |
| Minimum | 0.00102421 |
|
|
- Mean = 0.00115847
- Std.dev = 3.63502e-05
- 1 item below graph minimum of 0.00103198
- 5 items above graph maximum of 0.00128664
|
Notes
Weighted-mean L1 in tract right uncinate fasciculus (from dMRI data)
0 Related Data-Fields
There are no related data-fields

