Data
83,909 items of data are available, covering 79,382 participants.
Defined-instances run from 2 to 3, labelled using Instancing
2.
Units of measurement are AU.
| Maximum | 0.00147414 |
| Decile 9 | 0.000677291 |
| Decile 8 | 0.000661408 |
| Decile 7 | 0.000649909 |
| Decile 6 | 0.000640292 |
| Median | 0.000631345 |
| Decile 4 | 0.000622412 |
| Decile 3 | 0.000612794 |
| Decile 2 | 0.000601691 |
| Decile 1 | 0.000586334 |
| Minimum | 0 |
|
|
- Mean = 0.000631553
- Std.dev = 3.76385e-05
- 32 items below graph minimum of 0.000495377
- 23 items above graph maximum of 0.000768249
|
2 Instances
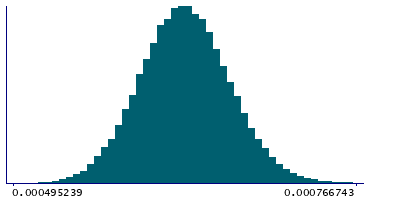
Instance 2 : Imaging visit (2014+)
79,151 participants, 79,151 items
| Maximum | 0.00147414 |
| Decile 9 | 0.000677541 |
| Decile 8 | 0.000661676 |
| Decile 7 | 0.000650123 |
| Decile 6 | 0.000640465 |
| Median | 0.00063143 |
| Decile 4 | 0.000622532 |
| Decile 3 | 0.000612892 |
| Decile 2 | 0.000601699 |
| Decile 1 | 0.000586297 |
| Minimum | 0 |
|

|
- Mean = 0.000631691
- Std.dev = 3.76733e-05
- 29 items below graph minimum of 0.000495053
- 23 items above graph maximum of 0.000768785
|
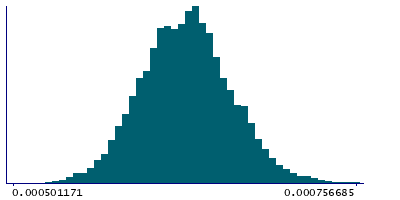
Instance 3 : First repeat imaging visit (2019+)
4,758 participants, 4,758 items
| Maximum | 0.000756685 |
| Decile 9 | 0.00067345 |
| Decile 8 | 0.000657166 |
| Decile 7 | 0.000646185 |
| Decile 6 | 0.000637345 |
| Median | 0.000629398 |
| Decile 4 | 0.000620484 |
| Decile 3 | 0.000611527 |
| Decile 2 | 0.000601608 |
| Decile 1 | 0.00058731 |
| Minimum | 0 |
|
|
- Mean = 0.000629257
- Std.dev = 3.6979e-05
- 3 items below graph minimum of 0.000501171
|
Notes
Weighted-mean L2 in tract right cingulate gyrus part of cingulum (from dMRI data)
0 Related Data-Fields
There are no related data-fields

