Data
83,909 items of data are available, covering 79,382 participants.
Defined-instances run from 2 to 3, labelled using Instancing
2.
Units of measurement are AU.
| Maximum | 0.00148066 |
| Decile 9 | 0.000782742 |
| Decile 8 | 0.000755159 |
| Decile 7 | 0.00073876 |
| Decile 6 | 0.000726645 |
| Median | 0.000716236 |
| Decile 4 | 0.00070652 |
| Decile 3 | 0.000696873 |
| Decile 2 | 0.00068615 |
| Decile 1 | 0.000671977 |
| Minimum | 0 |
|

|
- Mean = 0.000723541
- Std.dev = 5.04539e-05
- 23 items below graph minimum of 0.000561213
- 718 items above graph maximum of 0.000893507
|
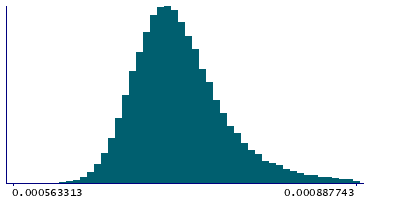
2 Instances
Instance 2 : Imaging visit (2014+)
79,151 participants, 79,151 items
| Maximum | 0.00148066 |
| Decile 9 | 0.000783719 |
| Decile 8 | 0.000755956 |
| Decile 7 | 0.000739584 |
| Decile 6 | 0.0007274 |
| Median | 0.000716915 |
| Decile 4 | 0.000707282 |
| Decile 3 | 0.000697549 |
| Decile 2 | 0.000686796 |
| Decile 1 | 0.000672591 |
| Minimum | 0 |
|
|
- Mean = 0.00072433
- Std.dev = 5.05007e-05
- 20 items below graph minimum of 0.000561462
- 682 items above graph maximum of 0.000894848
|
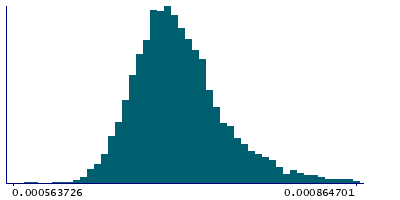
Instance 3 : First repeat imaging visit (2019+)
4,758 participants, 4,758 items
| Maximum | 0.00132646 |
| Decile 9 | 0.000764424 |
| Decile 8 | 0.000738676 |
| Decile 7 | 0.000725278 |
| Decile 6 | 0.000714079 |
| Median | 0.000704389 |
| Decile 4 | 0.000695907 |
| Decile 3 | 0.000686912 |
| Decile 2 | 0.000676931 |
| Decile 1 | 0.000664047 |
| Minimum | 0 |
|
|
- Mean = 0.000710407
- Std.dev = 4.77932e-05
- 3 items below graph minimum of 0.00056367
- 35 items above graph maximum of 0.000864801
|
Notes
Weighted-mean L2 in tract right posterior thalamic radiation (from dMRI data)
0 Related Data-Fields
There are no related data-fields

