Data
83,909 items of data are available, covering 79,382 participants.
Defined-instances run from 2 to 3, labelled using Instancing
2.
Units of measurement are AU.
| Maximum | 0.00235811 |
| Decile 9 | 0.000747562 |
| Decile 8 | 0.000705101 |
| Decile 7 | 0.000681283 |
| Decile 6 | 0.000663662 |
| Median | 0.000649033 |
| Decile 4 | 0.000635334 |
| Decile 3 | 0.000622194 |
| Decile 2 | 0.00060744 |
| Decile 1 | 0.000588154 |
| Minimum | 0 |
|

|
- Mean = 0.00066197
- Std.dev = 7.49544e-05
- 22 items below graph minimum of 0.000428746
- 1103 items above graph maximum of 0.000906971
|
2 Instances
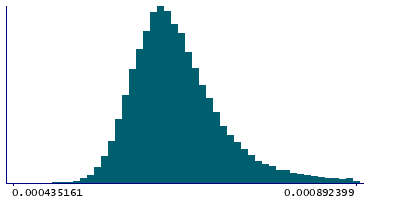
Instance 2 : Imaging visit (2014+)
79,151 participants, 79,151 items
| Maximum | 0.00235811 |
| Decile 9 | 0.000748706 |
| Decile 8 | 0.000705937 |
| Decile 7 | 0.000681909 |
| Decile 6 | 0.000664276 |
| Median | 0.000649491 |
| Decile 4 | 0.000635729 |
| Decile 3 | 0.000622556 |
| Decile 2 | 0.000607747 |
| Decile 1 | 0.000588489 |
| Minimum | 0 |
|
|
- Mean = 0.000662601
- Std.dev = 7.53338e-05
- 19 items below graph minimum of 0.000428272
- 1032 items above graph maximum of 0.000908923
|
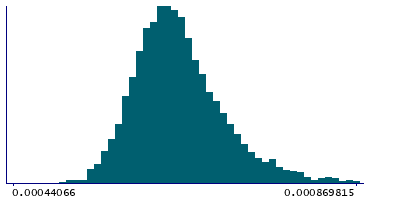
Instance 3 : First repeat imaging visit (2019+)
4,758 participants, 4,758 items
| Maximum | 0.00124824 |
| Decile 9 | 0.000726785 |
| Decile 8 | 0.000692387 |
| Decile 7 | 0.000670383 |
| Decile 6 | 0.000654648 |
| Median | 0.000641485 |
| Decile 4 | 0.000629317 |
| Decile 3 | 0.000616522 |
| Decile 2 | 0.000602628 |
| Decile 1 | 0.000583785 |
| Minimum | 0 |
|
|
- Mean = 0.000651462
- Std.dev = 6.74727e-05
- 3 items below graph minimum of 0.000440785
- 66 items above graph maximum of 0.000869785
|
Notes
Weighted-mean L3 in tract left parahippocampal part of cingulum (from dMRI data)
0 Related Data-Fields
There are no related data-fields

