Data
83,905 items of data are available, covering 79,378 participants.
Defined-instances run from 2 to 3, labelled using Instancing
2.
Units of measurement are AU.
| Maximum | 0.988738 |
| Decile 9 | 0.641593 |
| Decile 8 | 0.628889 |
| Decile 7 | 0.619462 |
| Decile 6 | 0.611317 |
| Median | 0.603337 |
| Decile 4 | 0.595402 |
| Decile 3 | 0.58656 |
| Decile 2 | 0.575871 |
| Decile 1 | 0.559737 |
| Minimum | 0 |
|

|
- Mean = 0.601571
- Std.dev = 0.0343391
- 170 items below graph minimum of 0.477881
- 33 items above graph maximum of 0.723449
|
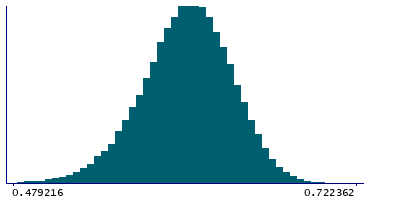
2 Instances
Instance 2 : Imaging visit (2014+)
79,147 participants, 79,147 items
| Maximum | 0.988738 |
| Decile 9 | 0.641506 |
| Decile 8 | 0.62879 |
| Decile 7 | 0.619337 |
| Decile 6 | 0.611211 |
| Median | 0.603209 |
| Decile 4 | 0.595203 |
| Decile 3 | 0.586345 |
| Decile 2 | 0.575623 |
| Decile 1 | 0.559379 |
| Minimum | 0 |
|
|
- Mean = 0.601397
- Std.dev = 0.0344426
- 162 items below graph minimum of 0.477252
- 31 items above graph maximum of 0.723633
|
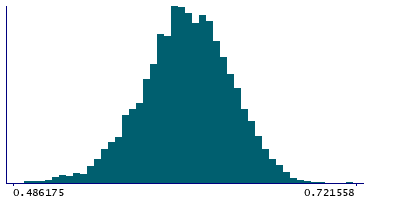
Instance 3 : First repeat imaging visit (2019+)
4,758 participants, 4,758 items
| Maximum | 0.834302 |
| Decile 9 | 0.643146 |
| Decile 8 | 0.630443 |
| Decile 7 | 0.621195 |
| Decile 6 | 0.61356 |
| Median | 0.605457 |
| Decile 4 | 0.597898 |
| Decile 3 | 0.589622 |
| Decile 2 | 0.58006 |
| Decile 1 | 0.564635 |
| Minimum | 0 |
|
|
- Mean = 0.60446
- Std.dev = 0.0324335
- 7 items below graph minimum of 0.486124
- 2 items above graph maximum of 0.721657
|
Notes
Weighted-mean ICVF (intra-cellular volume fraction) in tract forceps major (from dMRI data)
0 Related Data-Fields
There are no related data-fields

