Data
64,941 items of data are available, covering 60,413 participants.
Defined-instances run from 2 to 3, labelled using Instancing
2.
Units of measurement are AU.
| Maximum | 0.99 |
| Decile 9 | 0.6368 |
| Decile 8 | 0.6262 |
| Decile 7 | 0.618261 |
| Decile 6 | 0.611354 |
| Median | 0.604825 |
| Decile 4 | 0.598103 |
| Decile 3 | 0.590657 |
| Decile 2 | 0.581588 |
| Decile 1 | 0.56791 |
| Minimum | 0 |
|
|
- Mean = 0.603219
- Std.dev = 0.030148
- 184 items below graph minimum of 0.499019
- 38 items above graph maximum of 0.705691
|
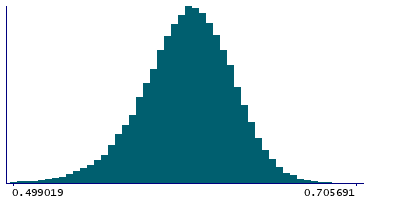
2 Instances
Instance 2 : Imaging visit (2014+)
60,181 participants, 60,181 items
| Maximum | 0.99 |
| Decile 9 | 0.636902 |
| Decile 8 | 0.62626 |
| Decile 7 | 0.618323 |
| Decile 6 | 0.611369 |
| Median | 0.60481 |
| Decile 4 | 0.598072 |
| Decile 3 | 0.590603 |
| Decile 2 | 0.581482 |
| Decile 1 | 0.567715 |
| Minimum | 0 |
|

|
- Mean = 0.603181
- Std.dev = 0.0303165
- 172 items below graph minimum of 0.498529
- 35 items above graph maximum of 0.706089
|
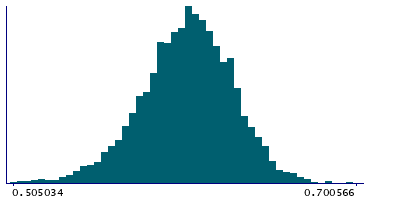
Instance 3 : First repeat imaging visit (2019+)
4,760 participants, 4,760 items
| Maximum | 0.984426 |
| Decile 9 | 0.635389 |
| Decile 8 | 0.625697 |
| Decile 7 | 0.617758 |
| Decile 6 | 0.611178 |
| Median | 0.605007 |
| Decile 4 | 0.598436 |
| Decile 3 | 0.591304 |
| Decile 2 | 0.583105 |
| Decile 1 | 0.570212 |
| Minimum | 0.396465 |
|
|
- Mean = 0.603693
- Std.dev = 0.0279268
- 11 items below graph minimum of 0.505034
- 3 items above graph maximum of 0.700566
|
Notes
Weighted-mean ICVF (intra-cellular volume fraction) in tract right superior thalamic radiation (from dMRI data)
0 Related Data-Fields
There are no related data-fields

