Data
83,905 items of data are available, covering 79,378 participants.
Defined-instances run from 2 to 3, labelled using Instancing
2.
Units of measurement are AU.
| Maximum | 0.47185 |
| Decile 9 | 0.100427 |
| Decile 8 | 0.0929426 |
| Decile 7 | 0.0881148 |
| Decile 6 | 0.0842477 |
| Median | 0.0809341 |
| Decile 4 | 0.0777204 |
| Decile 3 | 0.0744603 |
| Decile 2 | 0.0706834 |
| Decile 1 | 0.0654532 |
| Minimum | 0 |
|

|
- Mean = 0.0820818
- Std.dev = 0.0147238
- 240 items above graph maximum of 0.1354
|
2 Instances
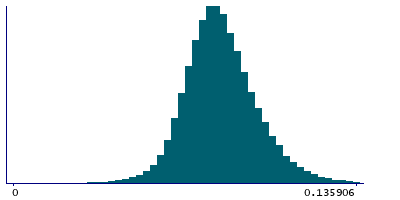
Instance 2 : Imaging visit (2014+)
79,147 participants, 79,147 items
| Maximum | 0.47185 |
| Decile 9 | 0.10054 |
| Decile 8 | 0.0930045 |
| Decile 7 | 0.088149 |
| Decile 6 | 0.0842595 |
| Median | 0.0809205 |
| Decile 4 | 0.0776868 |
| Decile 3 | 0.0743891 |
| Decile 2 | 0.0705545 |
| Decile 1 | 0.0652937 |
| Minimum | 0 |
|
|
- Mean = 0.0820522
- Std.dev = 0.0148207
- 219 items above graph maximum of 0.135786
|
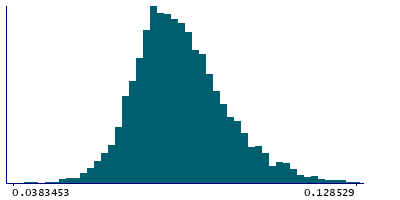
Instance 3 : First repeat imaging visit (2019+)
4,758 participants, 4,758 items
| Maximum | 0.251278 |
| Decile 9 | 0.0984947 |
| Decile 8 | 0.0917906 |
| Decile 7 | 0.0875554 |
| Decile 6 | 0.0841149 |
| Median | 0.0811417 |
| Decile 4 | 0.0782423 |
| Decile 3 | 0.0755054 |
| Decile 2 | 0.0725653 |
| Decile 1 | 0.0684059 |
| Minimum | 0.0268626 |
|
|
- Mean = 0.0825739
- Std.dev = 0.0129962
- 1 item below graph minimum of 0.038317
- 23 items above graph maximum of 0.128584
|
Notes
Weighted-mean ISOVF (isotropic or free water volume fraction) in tract right superior thalamic radiation (from dMRI data)
0 Related Data-Fields
There are no related data-fields

