Data
86,657 items of data are available, covering 82,012 participants.
Defined-instances run from 2 to 3, labelled using Instancing
2.
Units of measurement are AU.
| Maximum | 0.860418 |
| Decile 9 | 0.535559 |
| Decile 8 | 0.520395 |
| Decile 7 | 0.509937 |
| Decile 6 | 0.501254 |
| Median | 0.493198 |
| Decile 4 | 0.485175 |
| Decile 3 | 0.476773 |
| Decile 2 | 0.466976 |
| Decile 1 | 0.453535 |
| Minimum | 0.340738 |
|

|
- Mean = 0.49426
- Std.dev = 0.0325969
- 5 items below graph minimum of 0.37151
- 122 items above graph maximum of 0.617583
|
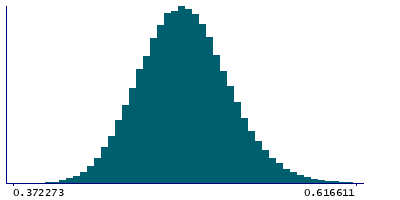
2 Instances
Instance 2 : Imaging visit (2014+)
81,876 participants, 81,876 items
| Maximum | 0.784363 |
| Decile 9 | 0.535913 |
| Decile 8 | 0.520653 |
| Decile 7 | 0.51018 |
| Decile 6 | 0.501462 |
| Median | 0.493412 |
| Decile 4 | 0.485388 |
| Decile 3 | 0.476969 |
| Decile 2 | 0.467145 |
| Decile 1 | 0.453723 |
| Minimum | 0.340738 |
|
|
- Mean = 0.494494
- Std.dev = 0.0326552
- 5 items below graph minimum of 0.371532
- 118 items above graph maximum of 0.618104
|
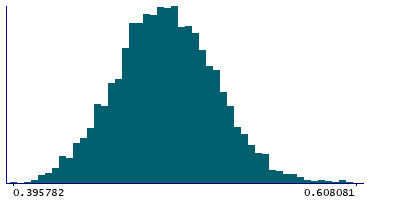
Instance 3 : First repeat imaging visit (2019+)
4,781 participants, 4,781 items
| Maximum | 0.860418 |
| Decile 9 | 0.52933 |
| Decile 8 | 0.516016 |
| Decile 7 | 0.506192 |
| Decile 6 | 0.497359 |
| Median | 0.489515 |
| Decile 4 | 0.481776 |
| Decile 3 | 0.473402 |
| Decile 2 | 0.464494 |
| Decile 1 | 0.450578 |
| Minimum | 0.395782 |
|
|
- Mean = 0.49026
- Std.dev = 0.031313
- 6 items above graph maximum of 0.608081
|
Notes
Discrepancy between the T1 brain image (nonlinearly-aligned to standard space) and the standard-space brain template
0 Related Data-Fields
There are no related data-fields


