Data
70,320 items of data are available, covering 66,459 participants.
Defined-instances run from 2 to 3, labelled using Instancing
2.
Units of measurement are percent.
| Maximum | 14.36 |
| Decile 9 | 2.953 |
| Decile 8 | 2.617 |
| Decile 7 | 2.396 |
| Decile 6 | 2.22 |
| Median | 2.058 |
| Decile 4 | 1.904 |
| Decile 3 | 1.744 |
| Decile 2 | 1.556 |
| Decile 1 | 1.308 |
| Minimum | -2.119 |
|
|
- Mean = 2.09805
- Std.dev = 0.685663
- 13 items below graph minimum of -0.337
- 161 items above graph maximum of 4.598
|
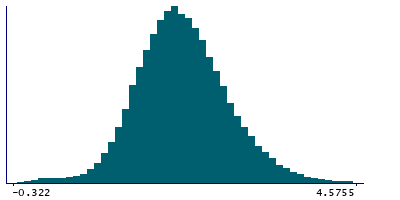
2 Instances
Instance 2 : Imaging visit (2014+)
66,036 participants, 66,036 items
| Maximum | 14.36 |
| Decile 9 | 2.965 |
| Decile 8 | 2.627 |
| Decile 7 | 2.406 |
| Decile 6 | 2.229 |
| Median | 2.068 |
| Decile 4 | 1.912 |
| Decile 3 | 1.75 |
| Decile 2 | 1.562 |
| Decile 1 | 1.31 |
| Minimum | -2.119 |
|
|
- Mean = 2.10602
- Std.dev = 0.688896
- 13 items below graph minimum of -0.345
- 151 items above graph maximum of 4.62
|
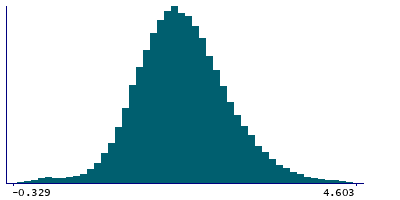
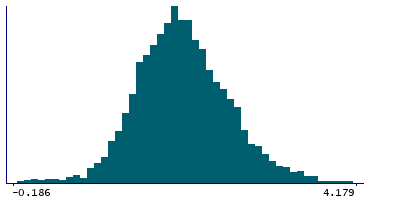
Instance 3 : First repeat imaging visit (2019+)
4,284 participants, 4,284 items
| Maximum | 9.187 |
| Decile 9 | 2.724 |
| Decile 8 | 2.456 |
| Decile 7 | 2.235 |
| Decile 6 | 2.078 |
| Median | 1.937 |
| Decile 4 | 1.8055 |
| Decile 3 | 1.6575 |
| Decile 2 | 1.4865 |
| Decile 1 | 1.269 |
| Minimum | -0.247 |
|
|
- Mean = 1.97531
- Std.dev = 0.62096
- 1 item below graph minimum of -0.186
- 14 items above graph maximum of 4.179
|