Data
65,934 items of data are available, covering 61,363 participants.
Defined-instances run from 2 to 3, labelled using Instancing
2.
Units of measurement are mm3.
| Maximum | 114938 |
| Decile 9 | 12301 |
| Decile 8 | 7437.5 |
| Decile 7 | 5229.5 |
| Decile 6 | 3907 |
| Median | 3005 |
| Decile 4 | 2353 |
| Decile 3 | 1833 |
| Decile 2 | 1372 |
| Decile 1 | 924 |
| Minimum | 9 |
|

|
- Mean = 5381.44
- Std.dev = 7098.61
- 1864 items above graph maximum of 23678
|
2 Instances
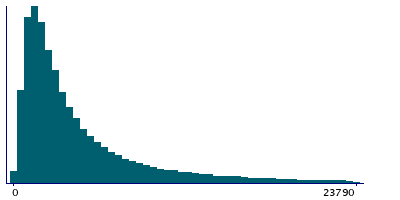
Instance 2 : Imaging visit (2014+)
61,172 participants, 61,172 items
| Maximum | 114938 |
| Decile 9 | 12356.5 |
| Decile 8 | 7447.5 |
| Decile 7 | 5236 |
| Decile 6 | 3913 |
| Median | 3009 |
| Decile 4 | 2356 |
| Decile 3 | 1833 |
| Decile 2 | 1373 |
| Decile 1 | 923 |
| Minimum | 9 |
|
|
- Mean = 5397.16
- Std.dev = 7139.16
- 1716 items above graph maximum of 23790
|
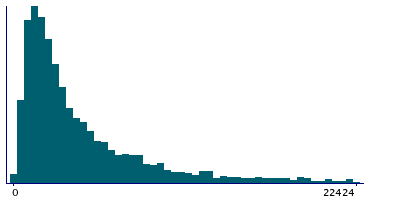
Instance 3 : First repeat imaging visit (2019+)
4,762 participants, 4,762 items
| Maximum | 76853 |
| Decile 9 | 11683 |
| Decile 8 | 7293.5 |
| Decile 7 | 5151 |
| Decile 6 | 3856 |
| Median | 2941 |
| Decile 4 | 2317.5 |
| Decile 3 | 1831.5 |
| Decile 2 | 1365.5 |
| Decile 1 | 942 |
| Minimum | 82 |
|
|
- Mean = 5179.61
- Std.dev = 6552.06
- 138 items above graph maximum of 22424
|
Notes
Total volume of white matter hyperintensities (from T1 and T2_FLAIR images)
0 Related Data-Fields
There are no related data-fields

