Data
87,996 items of data are available, covering 83,313 participants.
Defined-instances run from 2 to 3, labelled using Instancing
2.
Units of measurement are AU.
| Maximum | 71.0166 |
| Decile 9 | 51.1519 |
| Decile 8 | 49.5913 |
| Decile 7 | 48.5034 |
| Decile 6 | 47.5802 |
| Median | 46.7067 |
| Decile 4 | 45.8272 |
| Decile 3 | 44.8641 |
| Decile 2 | 43.6504 |
| Decile 1 | 41.6198 |
| Minimum | 20.2745 |
|

|
- Mean = 46.4491
- Std.dev = 4.0242
- 415 items below graph minimum of 32.0877
- 11 items above graph maximum of 60.684
|
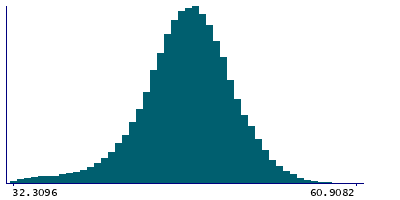
2 Instances
Instance 2 : Imaging visit (2014+)
83,241 participants, 83,241 items
| Maximum | 71.0166 |
| Decile 9 | 51.1285 |
| Decile 8 | 49.5696 |
| Decile 7 | 48.4816 |
| Decile 6 | 47.5589 |
| Median | 46.6854 |
| Decile 4 | 45.8047 |
| Decile 3 | 44.842 |
| Decile 2 | 43.6333 |
| Decile 1 | 41.5986 |
| Minimum | 20.4163 |
|
|
- Mean = 46.4288
- Std.dev = 4.01857
- 382 items below graph minimum of 32.0688
- 10 items above graph maximum of 60.6584
|
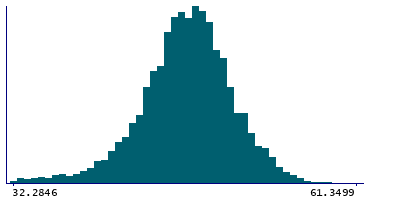
Instance 3 : First repeat imaging visit (2019+)
4,755 participants, 4,755 items
| Maximum | 62.867 |
| Decile 9 | 51.6615 |
| Decile 8 | 49.9693 |
| Decile 7 | 48.866 |
| Decile 6 | 47.9732 |
| Median | 47.0911 |
| Decile 4 | 46.1824 |
| Decile 3 | 45.2747 |
| Decile 2 | 43.9754 |
| Decile 1 | 41.9861 |
| Minimum | 20.2745 |
|
|
- Mean = 46.8046
- Std.dev = 4.10528
- 31 items below graph minimum of 32.3108
- 1 item above graph maximum of 61.3368
|
Notes
Mean intensity of CSF in the whole brain generated by subcortical volumetric segmentation (aseg)
0 Related Data-Fields
There are no related data-fields
0 Resources
There are no matching Resources
