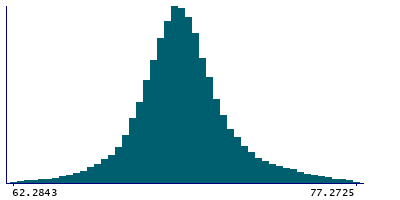
Data
87,996 items of data are available, covering 83,313 participants.
Defined-instances run from 2 to 3, labelled using Instancing
2.
Units of measurement are AU.
| Maximum | 90.6103 |
| Decile 9 | 72.4338 |
| Decile 8 | 71.1912 |
| Decile 7 | 70.5093 |
| Decile 6 | 70.0243 |
| Median | 69.6064 |
| Decile 4 | 69.2037 |
| Decile 3 | 68.7578 |
| Decile 2 | 68.2027 |
| Decile 1 | 67.3094 |
| Minimum | 29.7963 |
|
|
- Mean = 69.7023
- Std.dev = 2.33071
- 455 items below graph minimum of 62.1851
- 149 items above graph maximum of 77.5581
|
2 Instances
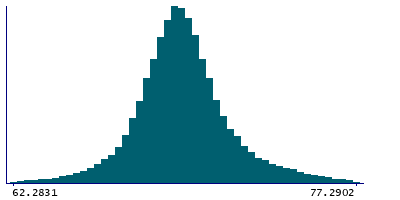
Instance 2 : Imaging visit (2014+)
83,241 participants, 83,241 items
| Maximum | 89.0422 |
| Decile 9 | 72.4493 |
| Decile 8 | 71.2001 |
| Decile 7 | 70.5161 |
| Decile 6 | 70.0269 |
| Median | 69.6075 |
| Decile 4 | 69.2039 |
| Decile 3 | 68.7575 |
| Decile 2 | 68.2029 |
| Decile 1 | 67.3173 |
| Minimum | 29.7963 |
|
|
- Mean = 69.7079
- Std.dev = 2.33157
- 419 items below graph minimum of 62.1853
- 136 items above graph maximum of 77.5812
|
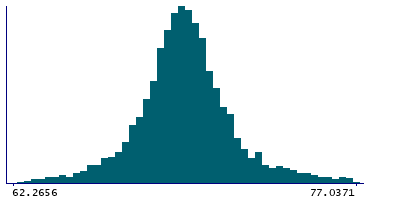
Instance 3 : First repeat imaging visit (2019+)
4,755 participants, 4,755 items
| Maximum | 90.6103 |
| Decile 9 | 72.1132 |
| Decile 8 | 71.0482 |
| Decile 7 | 70.4279 |
| Decile 6 | 69.9866 |
| Median | 69.5932 |
| Decile 4 | 69.202 |
| Decile 3 | 68.7618 |
| Decile 2 | 68.1992 |
| Decile 1 | 67.1894 |
| Minimum | 53.8591 |
|
|
- Mean = 69.6038
- Std.dev = 2.31336
- 36 items below graph minimum of 62.2656
- 16 items above graph maximum of 77.0371
|
Notes
Mean intensity of WM-hypointensities in the whole brain generated by subcortical volumetric segmentation (aseg)
0 Related Data-Fields
There are no related data-fields
0 Resources
There are no matching Resources
