Data
68,381 items of data are available, covering 63,696 participants.
Defined-instances run from 2 to 3, labelled using Instancing
2.
Units of measurement are AU.
| Maximum | 111.091 |
| Decile 9 | 80.5499 |
| Decile 8 | 78.9171 |
| Decile 7 | 77.7223 |
| Decile 6 | 76.6507 |
| Median | 75.6181 |
| Decile 4 | 74.5476 |
| Decile 3 | 73.3511 |
| Decile 2 | 71.901 |
| Decile 1 | 69.7848 |
| Minimum | 0 |
|
|
- Mean = 75.3284
- Std.dev = 4.33593
- 116 items below graph minimum of 59.0196
- 3 items above graph maximum of 91.3151
|
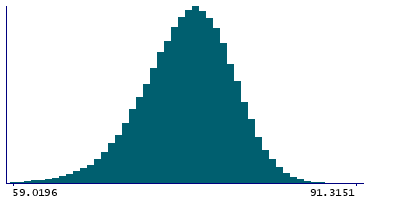
2 Instances
Instance 2 : Imaging visit (2014+)
63,624 participants, 63,624 items
| Maximum | 92.0239 |
| Decile 9 | 80.5568 |
| Decile 8 | 78.9222 |
| Decile 7 | 77.7275 |
| Decile 6 | 76.6587 |
| Median | 75.6281 |
| Decile 4 | 74.5602 |
| Decile 3 | 73.3703 |
| Decile 2 | 71.9258 |
| Decile 1 | 69.804 |
| Minimum | 0 |
|

|
- Mean = 75.34
- Std.dev = 4.33048
- 110 items below graph minimum of 59.0513
- 2 items above graph maximum of 91.3096
|
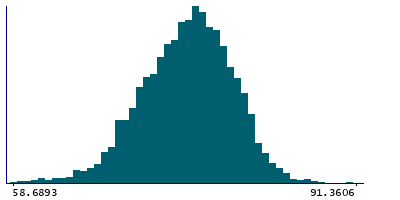
Instance 3 : First repeat imaging visit (2019+)
4,757 participants, 4,757 items
| Maximum | 111.091 |
| Decile 9 | 80.4701 |
| Decile 8 | 78.8538 |
| Decile 7 | 77.638 |
| Decile 6 | 76.5292 |
| Median | 75.4885 |
| Decile 4 | 74.3775 |
| Decile 3 | 73.0985 |
| Decile 2 | 71.5685 |
| Decile 1 | 69.5797 |
| Minimum | 43.5972 |
|
|
- Mean = 75.1732
- Std.dev = 4.40525
- 8 items below graph minimum of 58.6893
- 1 item above graph maximum of 91.3606
|
Notes
Mean intensity of Optic-Chiasm in the whole brain generated by subcortical volumetric segmentation (aseg)
0 Related Data-Fields
There are no related data-fields
0 Resources
There are no matching Resources
