Data
87,996 items of data are available, covering 83,313 participants.
Defined-instances run from 2 to 3, labelled using Instancing
2.
Units of measurement are mm3.
| Maximum | 1639.8 |
| Decile 9 | 662.1 |
| Decile 8 | 580.3 |
| Decile 7 | 538.4 |
| Decile 6 | 509.5 |
| Median | 486.1 |
| Decile 4 | 465.2 |
| Decile 3 | 444.8 |
| Decile 2 | 423.2 |
| Decile 1 | 394.6 |
| Minimum | 73 |
|
|
- Mean = 509.92
- Std.dev = 113.641
- 470 items above graph maximum of 929.6
|
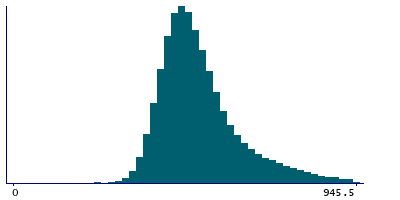
2 Instances
Instance 2 : Imaging visit (2014+)
83,241 participants, 83,241 items
| Maximum | 1639.8 |
| Decile 9 | 660.9 |
| Decile 8 | 579.5 |
| Decile 7 | 537.7 |
| Decile 6 | 508.9 |
| Median | 485.7 |
| Decile 4 | 464.8 |
| Decile 3 | 444.4 |
| Decile 2 | 422.8 |
| Decile 1 | 394.3 |
| Minimum | 73 |
|

|
- Mean = 509.314
- Std.dev = 113.34
- 452 items above graph maximum of 927.5
|
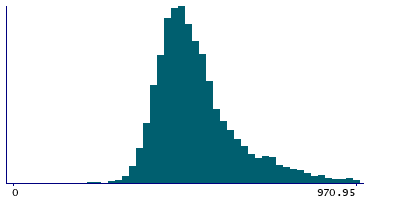
Instance 3 : First repeat imaging visit (2019+)
4,755 participants, 4,755 items
| Maximum | 1119.8 |
| Decile 9 | 685.7 |
| Decile 8 | 596.8 |
| Decile 7 | 549.45 |
| Decile 6 | 520.4 |
| Median | 494.25 |
| Decile 4 | 473.3 |
| Decile 3 | 451.6 |
| Decile 2 | 429.6 |
| Decile 1 | 400.95 |
| Minimum | 220.3 |
|
|
- Mean = 520.522
- Std.dev = 118.283
- 18 items above graph maximum of 970.45
|
Notes
Volume of CC-Central in the whole brain generated by subcortical volumetric segmentation (aseg)
0 Related Data-Fields
There are no related data-fields
0 Resources
There are no matching Resources
