Data
51,610 items of data are available, covering 46,924 participants.
Defined-instances run from 2 to 3, labelled using Instancing
2.
Units of measurement are mm3.
| Maximum | 501.963 |
| Decile 9 | 323.802 |
| Decile 8 | 306.222 |
| Decile 7 | 294.288 |
| Decile 6 | 284.483 |
| Median | 275.403 |
| Decile 4 | 266.655 |
| Decile 3 | 257.428 |
| Decile 2 | 246.846 |
| Decile 1 | 232.792 |
| Minimum | 45.5191 |
|
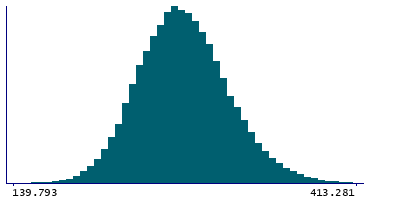
|
- Mean = 277.097
- Std.dev = 36.1682
- 14 items below graph minimum of 141.782
- 38 items above graph maximum of 414.812
|
2 Instances
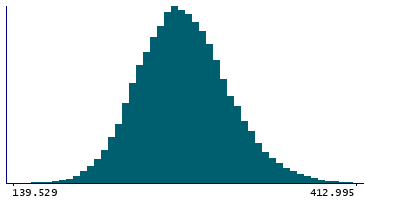
Instance 2 : Imaging visit (2014+)
46,852 participants, 46,852 items
| Maximum | 501.963 |
| Decile 9 | 323.592 |
| Decile 8 | 306.022 |
| Decile 7 | 294.129 |
| Decile 6 | 284.37 |
| Median | 275.201 |
| Decile 4 | 266.49 |
| Decile 3 | 257.306 |
| Decile 2 | 246.644 |
| Decile 1 | 232.594 |
| Minimum | 100.254 |
|
|
- Mean = 276.937
- Std.dev = 36.1643
- 10 items below graph minimum of 141.597
- 37 items above graph maximum of 414.59
|
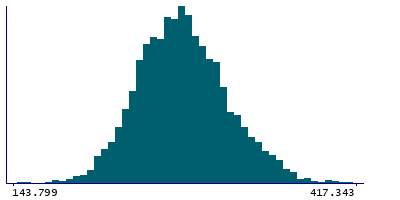
Instance 3 : First repeat imaging visit (2019+)
4,758 participants, 4,758 items
| Maximum | 452.909 |
| Decile 9 | 326.162 |
| Decile 8 | 307.596 |
| Decile 7 | 295.859 |
| Decile 6 | 285.523 |
| Median | 277.148 |
| Decile 4 | 268.145 |
| Decile 3 | 258.852 |
| Decile 2 | 248.627 |
| Decile 1 | 234.947 |
| Minimum | 45.5191 |
|
|
- Mean = 278.676
- Std.dev = 36.1684
- 4 items below graph minimum of 143.732
- 3 items above graph maximum of 417.376
|
Notes
Volume of subiculum-body in the left hemisphere generated by subcortical volumetric sub-segmentation of the Hippocampal Subfields
0 Related Data-Fields
There are no related data-fields
0 Resources
There are no matching Resources
