Data
51,610 items of data are available, covering 46,924 participants.
Defined-instances run from 2 to 3, labelled using Instancing
2.
Units of measurement are mm3.
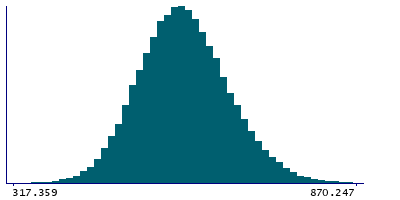
| Maximum | 940.878 |
| Decile 9 | 689.399 |
| Decile 8 | 654.509 |
| Decile 7 | 630.506 |
| Decile 6 | 610.603 |
| Median | 592.535 |
| Decile 4 | 574.809 |
| Decile 3 | 556.188 |
| Decile 2 | 534.576 |
| Decile 1 | 505.576 |
| Minimum | 202.262 |
|
|
- Mean = 595.245
- Std.dev = 72.6642
- 11 items below graph minimum of 321.752
- 25 items above graph maximum of 873.222
|
2 Instances
Instance 2 : Imaging visit (2014+)
46,852 participants, 46,852 items
| Maximum | 940.878 |
| Decile 9 | 689.499 |
| Decile 8 | 654.449 |
| Decile 7 | 630.414 |
| Decile 6 | 610.52 |
| Median | 592.444 |
| Decile 4 | 574.823 |
| Decile 3 | 556.307 |
| Decile 2 | 534.624 |
| Decile 1 | 505.56 |
| Minimum | 202.262 |
|

|
- Mean = 595.253
- Std.dev = 72.7053
- 10 items below graph minimum of 321.622
- 23 items above graph maximum of 873.438
|
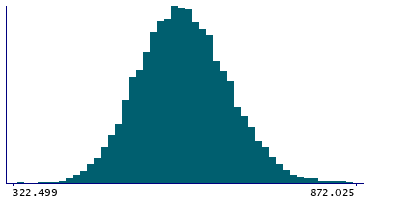
Instance 3 : First repeat imaging visit (2019+)
4,758 participants, 4,758 items
| Maximum | 921.851 |
| Decile 9 | 688.85 |
| Decile 8 | 655.317 |
| Decile 7 | 631.509 |
| Decile 6 | 611.134 |
| Median | 593.336 |
| Decile 4 | 574.669 |
| Decile 3 | 555.422 |
| Decile 2 | 534.019 |
| Decile 1 | 505.674 |
| Minimum | 283.956 |
|
|
- Mean = 595.167
- Std.dev = 72.2581
- 1 item below graph minimum of 322.499
- 2 items above graph maximum of 872.025
|
Notes
Volume of Hippocampal-tail in the right hemisphere generated by subcortical volumetric sub-segmentation of the Hippocampal Subfields
0 Related Data-Fields
There are no related data-fields
0 Resources
There are no matching Resources
