Data
51,610 items of data are available, covering 46,924 participants.
Defined-instances run from 2 to 3, labelled using Instancing
2.
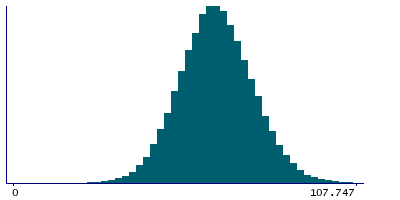
Units of measurement are mm3.
| Maximum | 147.597 |
| Decile 9 | 78.8563 |
| Decile 8 | 73.6938 |
| Decile 7 | 69.9306 |
| Decile 6 | 66.8636 |
| Median | 64.0106 |
| Decile 4 | 61.1413 |
| Decile 3 | 58.1916 |
| Decile 2 | 54.6135 |
| Decile 1 | 49.7295 |
| Minimum | 14.3684 |
|

|
- Mean = 64.1857
- Std.dev = 11.5428
- 18 items above graph maximum of 107.983
|
2 Instances
Instance 2 : Imaging visit (2014+)
46,852 participants, 46,852 items
| Maximum | 147.597 |
| Decile 9 | 78.8423 |
| Decile 8 | 73.6606 |
| Decile 7 | 69.8913 |
| Decile 6 | 66.7919 |
| Median | 63.9426 |
| Decile 4 | 61.1077 |
| Decile 3 | 58.1465 |
| Decile 2 | 54.5728 |
| Decile 1 | 49.7263 |
| Minimum | 14.3684 |
|
|
- Mean = 64.1468
- Std.dev = 11.5292
- 16 items above graph maximum of 107.958
|
Instance 3 : First repeat imaging visit (2019+)
4,758 participants, 4,758 items
| Maximum | 111.011 |
| Decile 9 | 79.1193 |
| Decile 8 | 74.0958 |
| Decile 7 | 70.4941 |
| Decile 6 | 67.6688 |
| Median | 64.727 |
| Decile 4 | 61.711 |
| Decile 3 | 58.5962 |
| Decile 2 | 55.1471 |
| Decile 1 | 49.8762 |
| Minimum | 18.0858 |
|

|
- Mean = 64.5685
- Std.dev = 11.6687
- 1 item above graph maximum of 108.362
|
Notes
Volume of HATA in the right hemisphere generated by subcortical volumetric sub-segmentation of the Hippocampal Subfields
0 Related Data-Fields
There are no related data-fields
0 Resources
There are no matching Resources
