Data
51,610 items of data are available, covering 46,924 participants.
Defined-instances run from 2 to 3, labelled using Instancing
2.
Units of measurement are mm2.
| Maximum | 2557 |
| Decile 9 | 1647 |
| Decile 8 | 1517 |
| Decile 7 | 1432 |
| Decile 6 | 1363 |
| Median | 1301 |
| Decile 4 | 1245 |
| Decile 3 | 1188 |
| Decile 2 | 1124 |
| Decile 1 | 1043 |
| Minimum | 553 |
|
|
- Mean = 1326.5
- Std.dev = 236.225
- 33 items above graph maximum of 2251
|
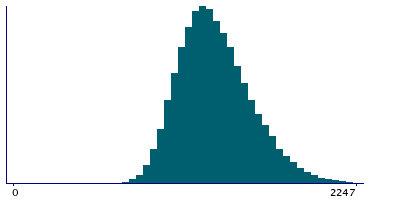
2 Instances
Instance 2 : Imaging visit (2014+)
46,852 participants, 46,852 items
| Maximum | 2557 |
| Decile 9 | 1648 |
| Decile 8 | 1518 |
| Decile 7 | 1432 |
| Decile 6 | 1363 |
| Median | 1302 |
| Decile 4 | 1245 |
| Decile 3 | 1188 |
| Decile 2 | 1124 |
| Decile 1 | 1043 |
| Minimum | 553 |
|

|
- Mean = 1326.7
- Std.dev = 236.442
- 31 items above graph maximum of 2253
|
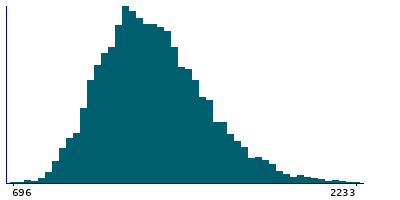
Instance 3 : First repeat imaging visit (2019+)
4,758 participants, 4,758 items
| Maximum | 2459 |
| Decile 9 | 1639 |
| Decile 8 | 1513 |
| Decile 7 | 1428 |
| Decile 6 | 1363 |
| Median | 1300 |
| Decile 4 | 1243 |
| Decile 3 | 1188 |
| Decile 2 | 1123 |
| Decile 1 | 1045 |
| Minimum | 696 |
|
|
- Mean = 1324.57
- Std.dev = 234.069
- 2 items above graph maximum of 2233
|
Notes
Area of pericalcarine in the right hemisphere generated by parcellation of the pial surface using Desikan-Killiany parcellation
0 Related Data-Fields
There are no related data-fields
0 Resources
There are no matching Resources
