Data
51,610 items of data are available, covering 46,924 participants.
Defined-instances run from 2 to 3, labelled using Instancing
2.
Units of measurement are AU.
| Maximum | 32.2346 |
| Decile 9 | 26.1959 |
| Decile 8 | 25.4569 |
| Decile 7 | 24.9347 |
| Decile 6 | 24.4973 |
| Median | 24.0875 |
| Decile 4 | 23.6783 |
| Decile 3 | 23.2504 |
| Decile 2 | 22.7522 |
| Decile 1 | 22.0424 |
| Minimum | 16.1722 |
|

|
- Mean = 24.1114
- Std.dev = 1.64973
- 25 items below graph minimum of 17.8889
- 29 items above graph maximum of 30.3494
|
2 Instances
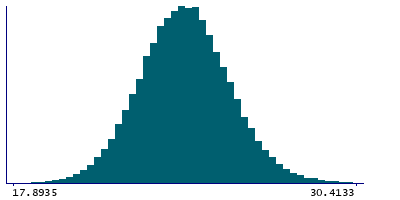
Instance 2 : Imaging visit (2014+)
46,852 participants, 46,852 items
| Maximum | 32.2346 |
| Decile 9 | 26.1651 |
| Decile 8 | 25.4301 |
| Decile 7 | 24.9076 |
| Decile 6 | 24.4723 |
| Median | 24.0649 |
| Decile 4 | 23.6587 |
| Decile 3 | 23.2302 |
| Decile 2 | 22.7332 |
| Decile 1 | 22.0233 |
| Minimum | 16.1722 |
|
|
- Mean = 24.0882
- Std.dev = 1.64759
- 23 items below graph minimum of 17.8815
- 26 items above graph maximum of 30.3068
|
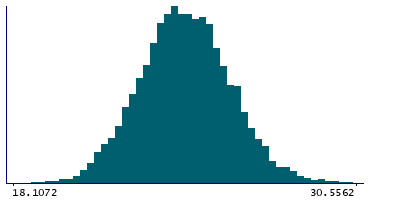
Instance 3 : First repeat imaging visit (2019+)
4,758 participants, 4,758 items
| Maximum | 31.7214 |
| Decile 9 | 26.4065 |
| Decile 8 | 25.7071 |
| Decile 7 | 25.1855 |
| Decile 6 | 24.7534 |
| Median | 24.315 |
| Decile 4 | 23.9074 |
| Decile 3 | 23.4671 |
| Decile 2 | 22.9715 |
| Decile 1 | 22.2569 |
| Minimum | 16.2457 |
|
|
- Mean = 24.339
- Std.dev = 1.65343
- 2 items below graph minimum of 18.1072
- 4 items above graph maximum of 30.5562
|
Notes
Grey-white contrast in lingual in the left hemisphere calculated as a percentage of the mean gray-white matter intensity from Desikan-Killiany parcellation
0 Related Data-Fields
There are no related data-fields
0 Resources
There are no matching Resources
