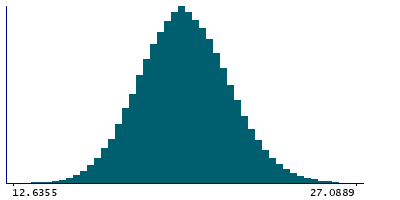
Data
51,610 items of data are available, covering 46,924 participants.
Defined-instances run from 2 to 3, labelled using Instancing
2.
Units of measurement are AU.
| Maximum | 30.4858 |
| Decile 9 | 22.2405 |
| Decile 8 | 21.3944 |
| Decile 7 | 20.7954 |
| Decile 6 | 20.2727 |
| Median | 19.807 |
| Decile 4 | 19.3381 |
| Decile 3 | 18.8298 |
| Decile 2 | 18.2424 |
| Decile 1 | 17.4509 |
| Minimum | 12.295 |
|
|
- Mean = 19.8336
- Std.dev = 1.87621
- 2 items below graph minimum of 12.6613
- 11 items above graph maximum of 27.0301
|
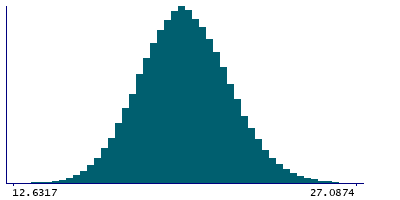
2 Instances
Instance 2 : Imaging visit (2014+)
46,852 participants, 46,852 items
| Maximum | 30.4858 |
| Decile 9 | 22.2356 |
| Decile 8 | 21.3937 |
| Decile 7 | 20.7921 |
| Decile 6 | 20.2692 |
| Median | 19.8057 |
| Decile 4 | 19.3332 |
| Decile 3 | 18.8246 |
| Decile 2 | 18.2377 |
| Decile 1 | 17.4462 |
| Minimum | 12.295 |
|
|
- Mean = 19.8306
- Std.dev = 1.8761
- 1 item below graph minimum of 12.6568
- 9 items above graph maximum of 27.0251
|
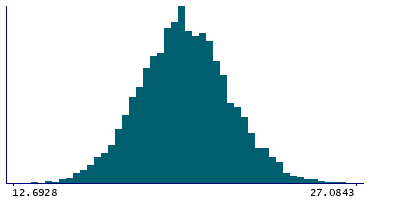
Instance 3 : First repeat imaging visit (2019+)
4,758 participants, 4,758 items
| Maximum | 27.6571 |
| Decile 9 | 22.2871 |
| Decile 8 | 21.3995 |
| Decile 7 | 20.826 |
| Decile 6 | 20.3201 |
| Median | 19.8222 |
| Decile 4 | 19.3835 |
| Decile 3 | 18.8978 |
| Decile 2 | 18.2899 |
| Decile 1 | 17.49 |
| Minimum | 12.4356 |
|
|
- Mean = 19.8637
- Std.dev = 1.87701
- 1 item below graph minimum of 12.6928
- 2 items above graph maximum of 27.0843
|
Notes
Grey-white contrast in transversetemporal in the left hemisphere calculated as a percentage of the mean gray-white matter intensity from Desikan-Killiany parcellation
0 Related Data-Fields
There are no related data-fields
0 Resources
There are no matching Resources
