Data
87,996 items of data are available, covering 83,313 participants.
Defined-instances run from 2 to 3, labelled using Instancing
2.
Units of measurement are mm2.
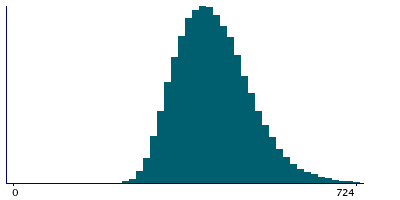
| Maximum | 1028 |
| Decile 9 | 525 |
| Decile 8 | 485 |
| Decile 7 | 458 |
| Decile 6 | 435 |
| Median | 415 |
| Decile 4 | 396 |
| Decile 3 | 376 |
| Decile 2 | 355 |
| Decile 1 | 328 |
| Minimum | 18 |
|
|
- Mean = 422.611
- Std.dev = 78.7772
- 200 items above graph maximum of 722
|
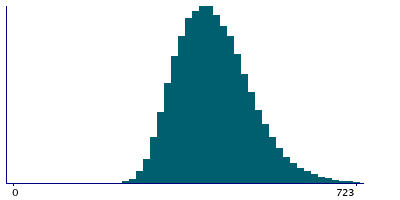
2 Instances
Instance 2 : Imaging visit (2014+)
83,241 participants, 83,241 items
| Maximum | 1028 |
| Decile 9 | 525 |
| Decile 8 | 485 |
| Decile 7 | 458 |
| Decile 6 | 435 |
| Median | 415 |
| Decile 4 | 396 |
| Decile 3 | 376 |
| Decile 2 | 355 |
| Decile 1 | 328 |
| Minimum | 18 |
|
|
- Mean = 422.62
- Std.dev = 78.788
- 192 items above graph maximum of 722
|
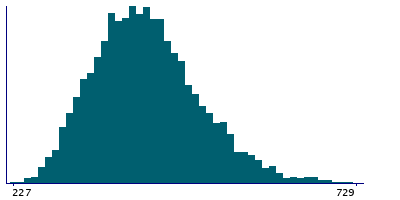
Instance 3 : First repeat imaging visit (2019+)
4,755 participants, 4,755 items
| Maximum | 844 |
| Decile 9 | 528 |
| Decile 8 | 484 |
| Decile 7 | 456 |
| Decile 6 | 435 |
| Median | 416 |
| Decile 4 | 397 |
| Decile 3 | 376 |
| Decile 2 | 356 |
| Decile 1 | 327 |
| Minimum | 227 |
|
|
- Mean = 422.456
- Std.dev = 78.5876
- 8 items above graph maximum of 729
|
Notes
Area of entorhinal in the left hemisphere generated by parcellation of the white surface using DKT parcellation
0 Related Data-Fields
There are no related data-fields
0 Resources
There are no matching Resources
