Data
68,381 items of data are available, covering 63,696 participants.
Defined-instances run from 2 to 3, labelled using Instancing
2.
Units of measurement are mm2.
| Maximum | 2564 |
| Decile 9 | 1717 |
| Decile 8 | 1592 |
| Decile 7 | 1506 |
| Decile 6 | 1435 |
| Median | 1371 |
| Decile 4 | 1310 |
| Decile 3 | 1247 |
| Decile 2 | 1178 |
| Decile 1 | 1089 |
| Minimum | 534 |
|
|
- Mean = 1389.55
- Std.dev = 245.371
- 31 items above graph maximum of 2345
|
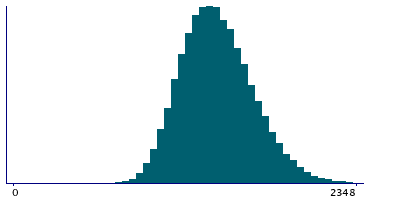
2 Instances
Instance 2 : Imaging visit (2014+)
63,624 participants, 63,624 items
| Maximum | 2564 |
| Decile 9 | 1717 |
| Decile 8 | 1592 |
| Decile 7 | 1506 |
| Decile 6 | 1435 |
| Median | 1371 |
| Decile 4 | 1309 |
| Decile 3 | 1247 |
| Decile 2 | 1177 |
| Decile 1 | 1088 |
| Minimum | 584 |
|

|
- Mean = 1389.12
- Std.dev = 245.496
- 28 items above graph maximum of 2346
|
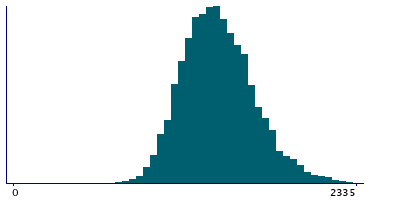
Instance 3 : First repeat imaging visit (2019+)
4,757 participants, 4,757 items
| Maximum | 2549 |
| Decile 9 | 1718.5 |
| Decile 8 | 1590 |
| Decile 7 | 1510 |
| Decile 6 | 1439 |
| Median | 1377 |
| Decile 4 | 1317 |
| Decile 3 | 1254 |
| Decile 2 | 1188.5 |
| Decile 1 | 1102 |
| Minimum | 534 |
|
|
- Mean = 1395.25
- Std.dev = 243.628
- 2 items above graph maximum of 2335
|
Notes
Area of pericalcarine in the left hemisphere generated by parcellation of the white surface using DKT parcellation
0 Related Data-Fields
There are no related data-fields
0 Resources
There are no matching Resources
