Data
87,996 items of data are available, covering 83,313 participants.
Defined-instances run from 2 to 3, labelled using Instancing
2.
Units of measurement are mm.
| Maximum | 3.437 |
| Decile 9 | 2.911 |
| Decile 8 | 2.834 |
| Decile 7 | 2.775 |
| Decile 6 | 2.724 |
| Median | 2.674 |
| Decile 4 | 2.621 |
| Decile 3 | 2.562 |
| Decile 2 | 2.491 |
| Decile 1 | 2.387 |
| Minimum | 1.596 |
|
|
- Mean = 2.65904
- Std.dev = 0.207069
- 57 items below graph minimum of 1.863
- 1 item above graph maximum of 3.435
|
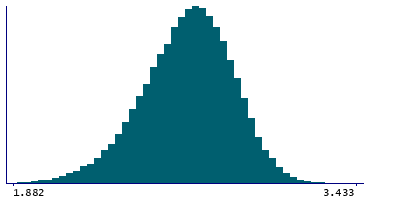
2 Instances
Instance 2 : Imaging visit (2014+)
83,241 participants, 83,241 items
| Maximum | 3.437 |
| Decile 9 | 2.91 |
| Decile 8 | 2.834 |
| Decile 7 | 2.775 |
| Decile 6 | 2.724 |
| Median | 2.673 |
| Decile 4 | 2.62 |
| Decile 3 | 2.562 |
| Decile 2 | 2.49 |
| Decile 1 | 2.386 |
| Minimum | 1.596 |
|

|
- Mean = 2.65828
- Std.dev = 0.207333
- 53 items below graph minimum of 1.862
- 1 item above graph maximum of 3.434
|
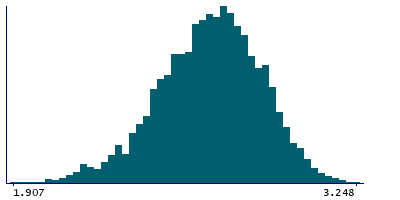
Instance 3 : First repeat imaging visit (2019+)
4,755 participants, 4,755 items
| Maximum | 3.248 |
| Decile 9 | 2.919 |
| Decile 8 | 2.845 |
| Decile 7 | 2.785 |
| Decile 6 | 2.735 |
| Median | 2.685 |
| Decile 4 | 2.635 |
| Decile 3 | 2.576 |
| Decile 2 | 2.507 |
| Decile 1 | 2.413 |
| Minimum | 1.697 |
|
|
- Mean = 2.67242
- Std.dev = 0.201911
- 3 items below graph minimum of 1.907
|
Notes
Mean thickness of paracentral in the left hemisphere generated by parcellation of the white surface using DKT parcellation
0 Related Data-Fields
There are no related data-fields
0 Resources
There are no matching Resources
