Data
68,381 items of data are available, covering 63,696 participants.
Defined-instances run from 2 to 3, labelled using Instancing
2.
Units of measurement are mm2.
| Maximum | 5537 |
| Decile 9 | 1433 |
| Decile 8 | 1344 |
| Decile 7 | 1282 |
| Decile 6 | 1232 |
| Median | 1189 |
| Decile 4 | 1145 |
| Decile 3 | 1100 |
| Decile 2 | 1050 |
| Decile 1 | 982 |
| Minimum | 470 |
|

|
- Mean = 1199.78
- Std.dev = 181.046
- 3 items below graph minimum of 531
- 77 items above graph maximum of 1884
|
2 Instances
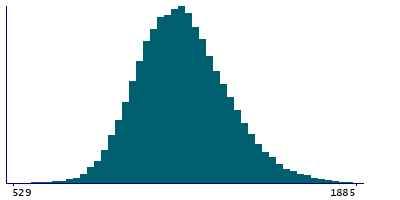
Instance 2 : Imaging visit (2014+)
63,624 participants, 63,624 items
| Maximum | 5537 |
| Decile 9 | 1433 |
| Decile 8 | 1344 |
| Decile 7 | 1281 |
| Decile 6 | 1232 |
| Median | 1188 |
| Decile 4 | 1145 |
| Decile 3 | 1099 |
| Decile 2 | 1049 |
| Decile 1 | 981 |
| Minimum | 470 |
|
|
- Mean = 1199.26
- Std.dev = 181.07
- 3 items below graph minimum of 529
- 69 items above graph maximum of 1885
|
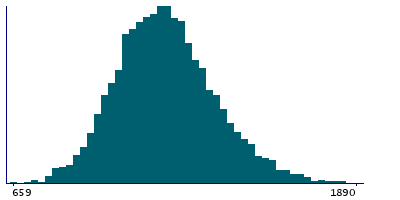
Instance 3 : First repeat imaging visit (2019+)
4,757 participants, 4,757 items
| Maximum | 3122 |
| Decile 9 | 1440 |
| Decile 8 | 1347.5 |
| Decile 7 | 1286 |
| Decile 6 | 1239 |
| Median | 1195.5 |
| Decile 4 | 1152 |
| Decile 3 | 1107.5 |
| Decile 2 | 1058 |
| Decile 1 | 990 |
| Minimum | 659 |
|
|
- Mean = 1206.72
- Std.dev = 180.586
- 7 items above graph maximum of 1890
|
Notes
Area of posteriorcingulate in the right hemisphere generated by parcellation of the white surface using DKT parcellation
0 Related Data-Fields
There are no related data-fields
0 Resources
There are no matching Resources
