Data
51,609 items of data are available, covering 46,923 participants.
Defined-instances run from 2 to 3, labelled using Instancing
2.
Units of measurement are mm2.
| Maximum | 467 |
| Decile 9 | 276 |
| Decile 8 | 251 |
| Decile 7 | 234 |
| Decile 6 | 220 |
| Median | 207 |
| Decile 4 | 194 |
| Decile 3 | 181 |
| Decile 2 | 166 |
| Decile 1 | 144 |
| Minimum | 0 |
|

|
- Mean = 208.909
- Std.dev = 52.3826
- 27 items above graph maximum of 408
|
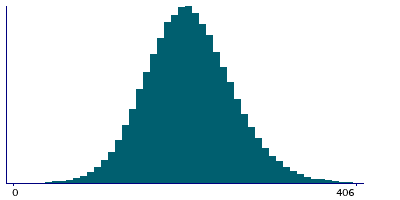
2 Instances
Instance 2 : Imaging visit (2014+)
46,851 participants, 46,851 items
| Maximum | 467 |
| Decile 9 | 276 |
| Decile 8 | 251 |
| Decile 7 | 234 |
| Decile 6 | 220 |
| Median | 207 |
| Decile 4 | 195 |
| Decile 3 | 181 |
| Decile 2 | 166 |
| Decile 1 | 144 |
| Minimum | 0 |
|
|
- Mean = 208.943
- Std.dev = 52.3295
- 24 items above graph maximum of 408
|
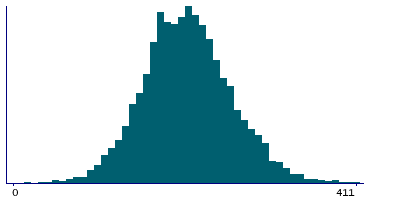
Instance 3 : First repeat imaging visit (2019+)
4,758 participants, 4,758 items
| Maximum | 435 |
| Decile 9 | 277.5 |
| Decile 8 | 251 |
| Decile 7 | 234 |
| Decile 6 | 220 |
| Median | 207 |
| Decile 4 | 193 |
| Decile 3 | 180 |
| Decile 2 | 166 |
| Decile 1 | 144 |
| Minimum | 19 |
|
|
- Mean = 208.577
- Std.dev = 52.9014
- 3 items above graph maximum of 411
|
Notes
Area of S-temporal-transverse in the right hemisphere generated by parcellation of the white surface using Destrieux (a2009s) parcellation
0 Related Data-Fields
There are no related data-fields
0 Resources
There are no matching Resources
